Nosocomial bloodstream infections (NBSIs) are adverse complications of hospitalization and represent ∼5% of hospital-acquired infections.1 NBSIs are associated with increased length of hospital stay and recurrent admissions, with high related costs, and case fatality rates of 30%–50% for some microorganisms.1–Reference Wenzel and Edmond4 Infection control interventions designed to prevent these infections focus mainly on minimizing evitable risk factors for acquisition, such as optimizing and reducing the use of indwelling devices (mainly intravenous or bladder catheters), which are major risk factors for infection.Reference Septimus and Moody5,Reference Chen, O’Malley and Chopra6
The impact of these interventions on NBSI rates have been extensively explored in intensive care unit (ICU) patients. Some of these well-proven interventions are being extrapolated and implemented in non-ICU patients. However, data focusing on specific educational interventions to reduce NBSI events in hospitalwide settings are limited.Reference Kallen, Patel and O’Grady7–Reference Leekha, Li and Thom14
Increasing staff awareness of preventable NBSI risk factors is a crucial step in reducing NBSI incidence. We assumed that self-investigation of NBSI events, conducted by healthcare providers (physicians and nurses without formal training in infection control practice) of patients who acquired NBSI “under their watch,” might effectively increase staff awareness. The objective of this study was to evaluate the impact of department-level NBSI investigations on NBSI incidence hospitalwide. The study was performed in accordance with the principles of the Declaration of Helsinki and was approved by the Institutional Ethics Committee of Meir Medical Center (no. 0239-21-MMC). Patient informed consent was not required for the use of anonymous data.
Methods
Meir Medical Center is a 780-bed secondary-care hospital with ∼66,000 admissions annually. Beginning in January 2016, positive blood cultures reported by the hospital’s microbiology laboratory were reviewed daily by the infection control unit staff and were classified as suspected nosocomial infection according to a customized protocol. An NBSI event was defined if 1 of criteria 1–3 plus criterion 4 were fulfilled:
-
1. A positive blood culture was drawn after the day 3 of admission (day 4 and after) from a patient with no evidence of infection upon admission to the hospital.
-
2. A positive blood culture was drawn within 7 days after discharge after a minimum hospitalization of 48 hours.
-
3. Positive blood culture was drawn within 7 days after an ambulatory procedure (eg, colonoscopy, cystoscopy, etc) performed at one of the hospital units or 30 days after a surgery performed at the hospital.
-
4. The isolated pathogen was not considered a skin contaminant. Bacterial isolates were classified as skin contaminates if a common commensal organism grew on a single blood culture or in >1 culture, but the event was not addressed as a true infection and no specific treatment was needed. The National Healthcare Safety Network (NHSN) commensal list was used. 15
Repeated positive blood cultures with isolations identical to previous blood cultures of the same patient were excluded.
Events matching the above criteria were automatically sent within 3 days after culture results to the personal healthcare providers of the patient who acquired the NBSI (physicians and nurses with no specific training in the field of infection control). A structured electronic questionnaire was used to complete these investigations (see Supplementary Materials online). Each department was requested to determine whether the suspected NBSI was indeed acquired during hospitalization and to assess risk factors for acquiring the infection while defining its likely source in their opinion and without adhering to strict surveillance definitions. As part of the questionnaire and based on the conclusions of the evaluations, investigators were asked to suggest suitable interventions that might prevent future events. The completed investigation reports were returned to the infection control team for analysis. Feedback regarding quality of data and investigation conclusions was given as needed. NBSI clusters or events related to specific procedures initiated immediate comprehensive investigation and intervention by the infection control team. A summary of the results was sent quarterly to the departments and to hospital administration. The summary included the calculated NBSI acquisition rates for each department compared to other related departments in the hospital, the distribution of the sources of infection (urinary catheter, central or peripheral vein line, ventilator, surgery site, intra-abdominal, skin, etc), and specific recommendations to prevent future events. In conjunction with the quarterly summaries, the results and their conclusions were presented to the hospital administration, which helped direct necessary resources to departments and care units with high infection rates.
To evaluate the baseline acquisition rates, an infectious diseases specialist retrospectively investigated BSI events recorded 2 years before the intervention (2014–2015) and determined whether they were hospital acquired by applying the same criteria noted above. NBSI sources and main pathogens, reflected by the department-level self-investigations from 2016 and onward, were collected and analyzed. We also analyzed data from patients admitted with community onset bloodstream infections (CO-BSI) during the same period. In addition, we compared blood-culture collection rates before and after the intervention (to verify that providers did not discourage blood culturing to avoid NBSI during the intervention). Sensitivity analysis data were analyzed according to the Centers for Disease Control (CDC) definitions for NBSI. 3
Statistical analysis
Data were presented as number and percentage for nominal variables and as mean or median for continuous data. Categorical variables were compared using the χ Reference Edmond, Wallace, McClish, Pfaller, Jones and Wenzel2 or Fisher exact test. Continuous variables were compared using Student t test or Mann-Whitney U test. P values <.05 were considered statistically significant. We performed interrupted time-series analyses of the monthly rate of NBSI per 1,000 admissions and the monthly blood-culture collection rate per 1,000 admissions using Newey-West standard errors. We included data from 24 months before and 36 months after initiation of the intervention in January 2016. Based on results of the test for autocorrelation, we specified an interlude of 4 months. When comparing the rate of CO-BSI events before and after the intervention, we used an interlude of zero because the intervention should not have affected the incidence of CO-BSI. The analyses were performed using SPSS version 27 software (IBM, Armonk, NY) and Stata version 14.2 software (StataCorp, College Park, TX) for the interrupted time-series analysis.
Results
NBSI events rates and characteristics
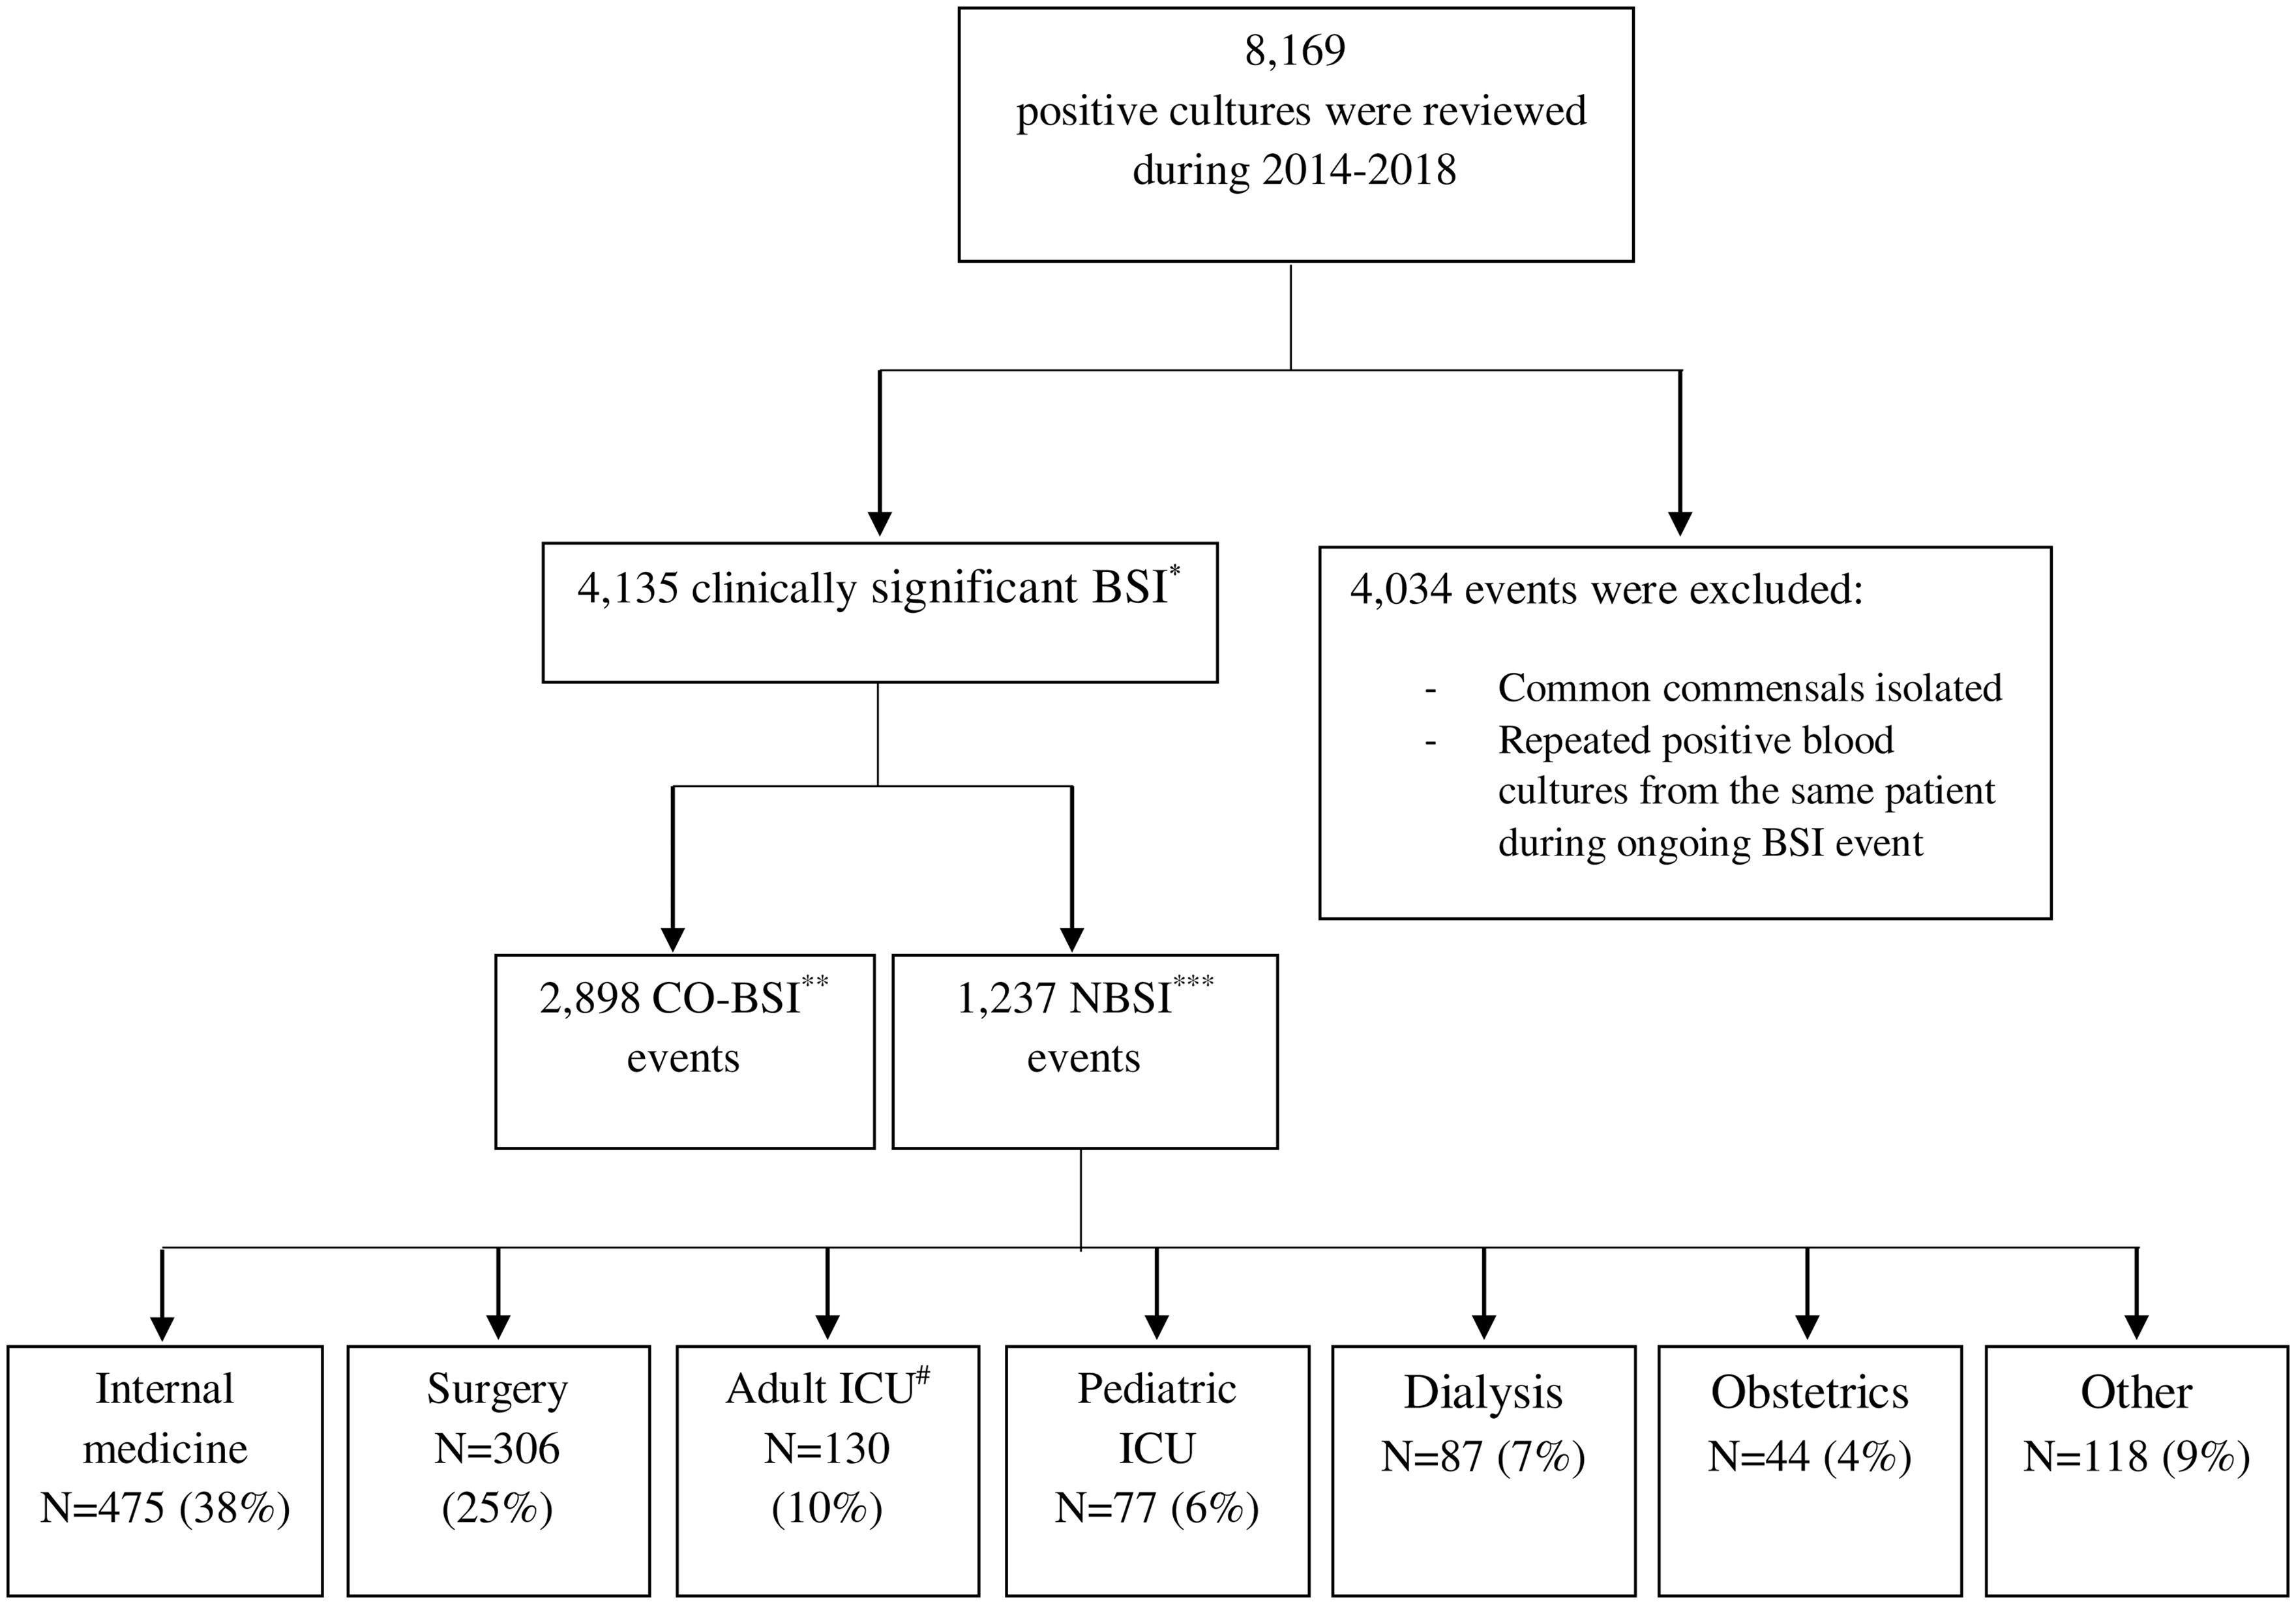
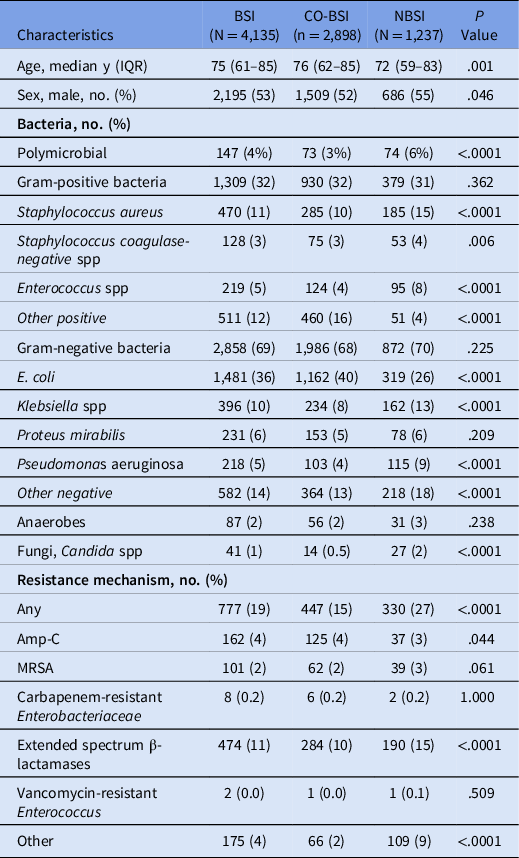
From January 2014 to December 2018, a total of 8,169 positive cultures were reviewed; 4,135 events were classified as clinically significant bloodstream infections (BSIs), and 4,034 (49%) were excluded due to isolation of common commensals or repeated positive blood cultures from the same patient during an ongoing BSI event. In total, 1,237 events were defined as NBSIs (30% of BSIs) according to the study protocol (Fig. 1). The median age of patients with an NBSI was 72 years (IQR, 59–83), and 55% were male (Table 1).

Fig. 1. NBSI events rate and distribution.
Note. *BSI, bloodstream infection; **CO-BSI, community onset bloodstream infection; ***NBSI, nosocomial bloodstream infection; #ICU, intensive care unit.
Table 1. Bloodstream Infections (BSIs): Patient Characteristics: Community-Onset Bloodstream Infection (CO-BSI) Versus Nosocomial Bloodstream Infection (NBSI)

Note. MRSA, methicillin-resistant Staphylococcus aureus.
NBSIs were more common among those hospitalized in internal medicine and surgery departments: 475 events (39%) and 306 events (25%), respectively (Table 2 and Fig. 1). NBSI events among adult and pediatric ICU patients represented only 16% of acquisitions.
Table 2. NBSI Events Characteristics Before and After the Intervention: Departments, Bacteria and Resistance Mechanisms

Note. MRSA, methicillin-resistant Staphylococcus aureus.
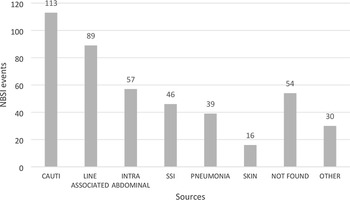
The most common sources of acquisition were catheter-associated urinary tract infection (CAUTI, n = 113, 17%), lines related (central and peripheral IV lines, n = 89, 14%) and intra-abdominal infections (n = 57, 9%) (Fig. 2). Overall, 334 (27%) of 1,237 patients with NBSI died in the hospital or within 30 days after acquisition and 457 (37%) patients died within 1 year. Recurrent hospitalizations within 180 days after the index hospitalization were documented in 28% of patients.

Fig. 2. Sources of NBSI events. Sources of 647 NBSI events during 2016–2018 according to self-investigation conclusions. Data are represented in absolute numbers. Some events had >1 possible source. Of 647 events, 247 (36%) were not investigated. Among 89 line-associated events, 47 (53%) were secondary to CLABSI.
Note. CAUTI, catheter-related urinary tract infection; SSI, surgical-site infection.
Intervention impact—interrupted time-series analysis
Among the 1,237 NBSI events, 590 were recorded before the intervention was initiated (35.3% of 1,672 true BSIs during 2014–2015), and 647 events were recorded after the intervention was implemented (26.3% of 2,463 true BSIs during 2016–2018; P < .001). The rate of NBSI decreased from 4.58 per 1,000 admissions in 2014 and 4.82 in 2015 to 3.81 in 2016, 2.94 in 2017, and 2.86 in 2018.
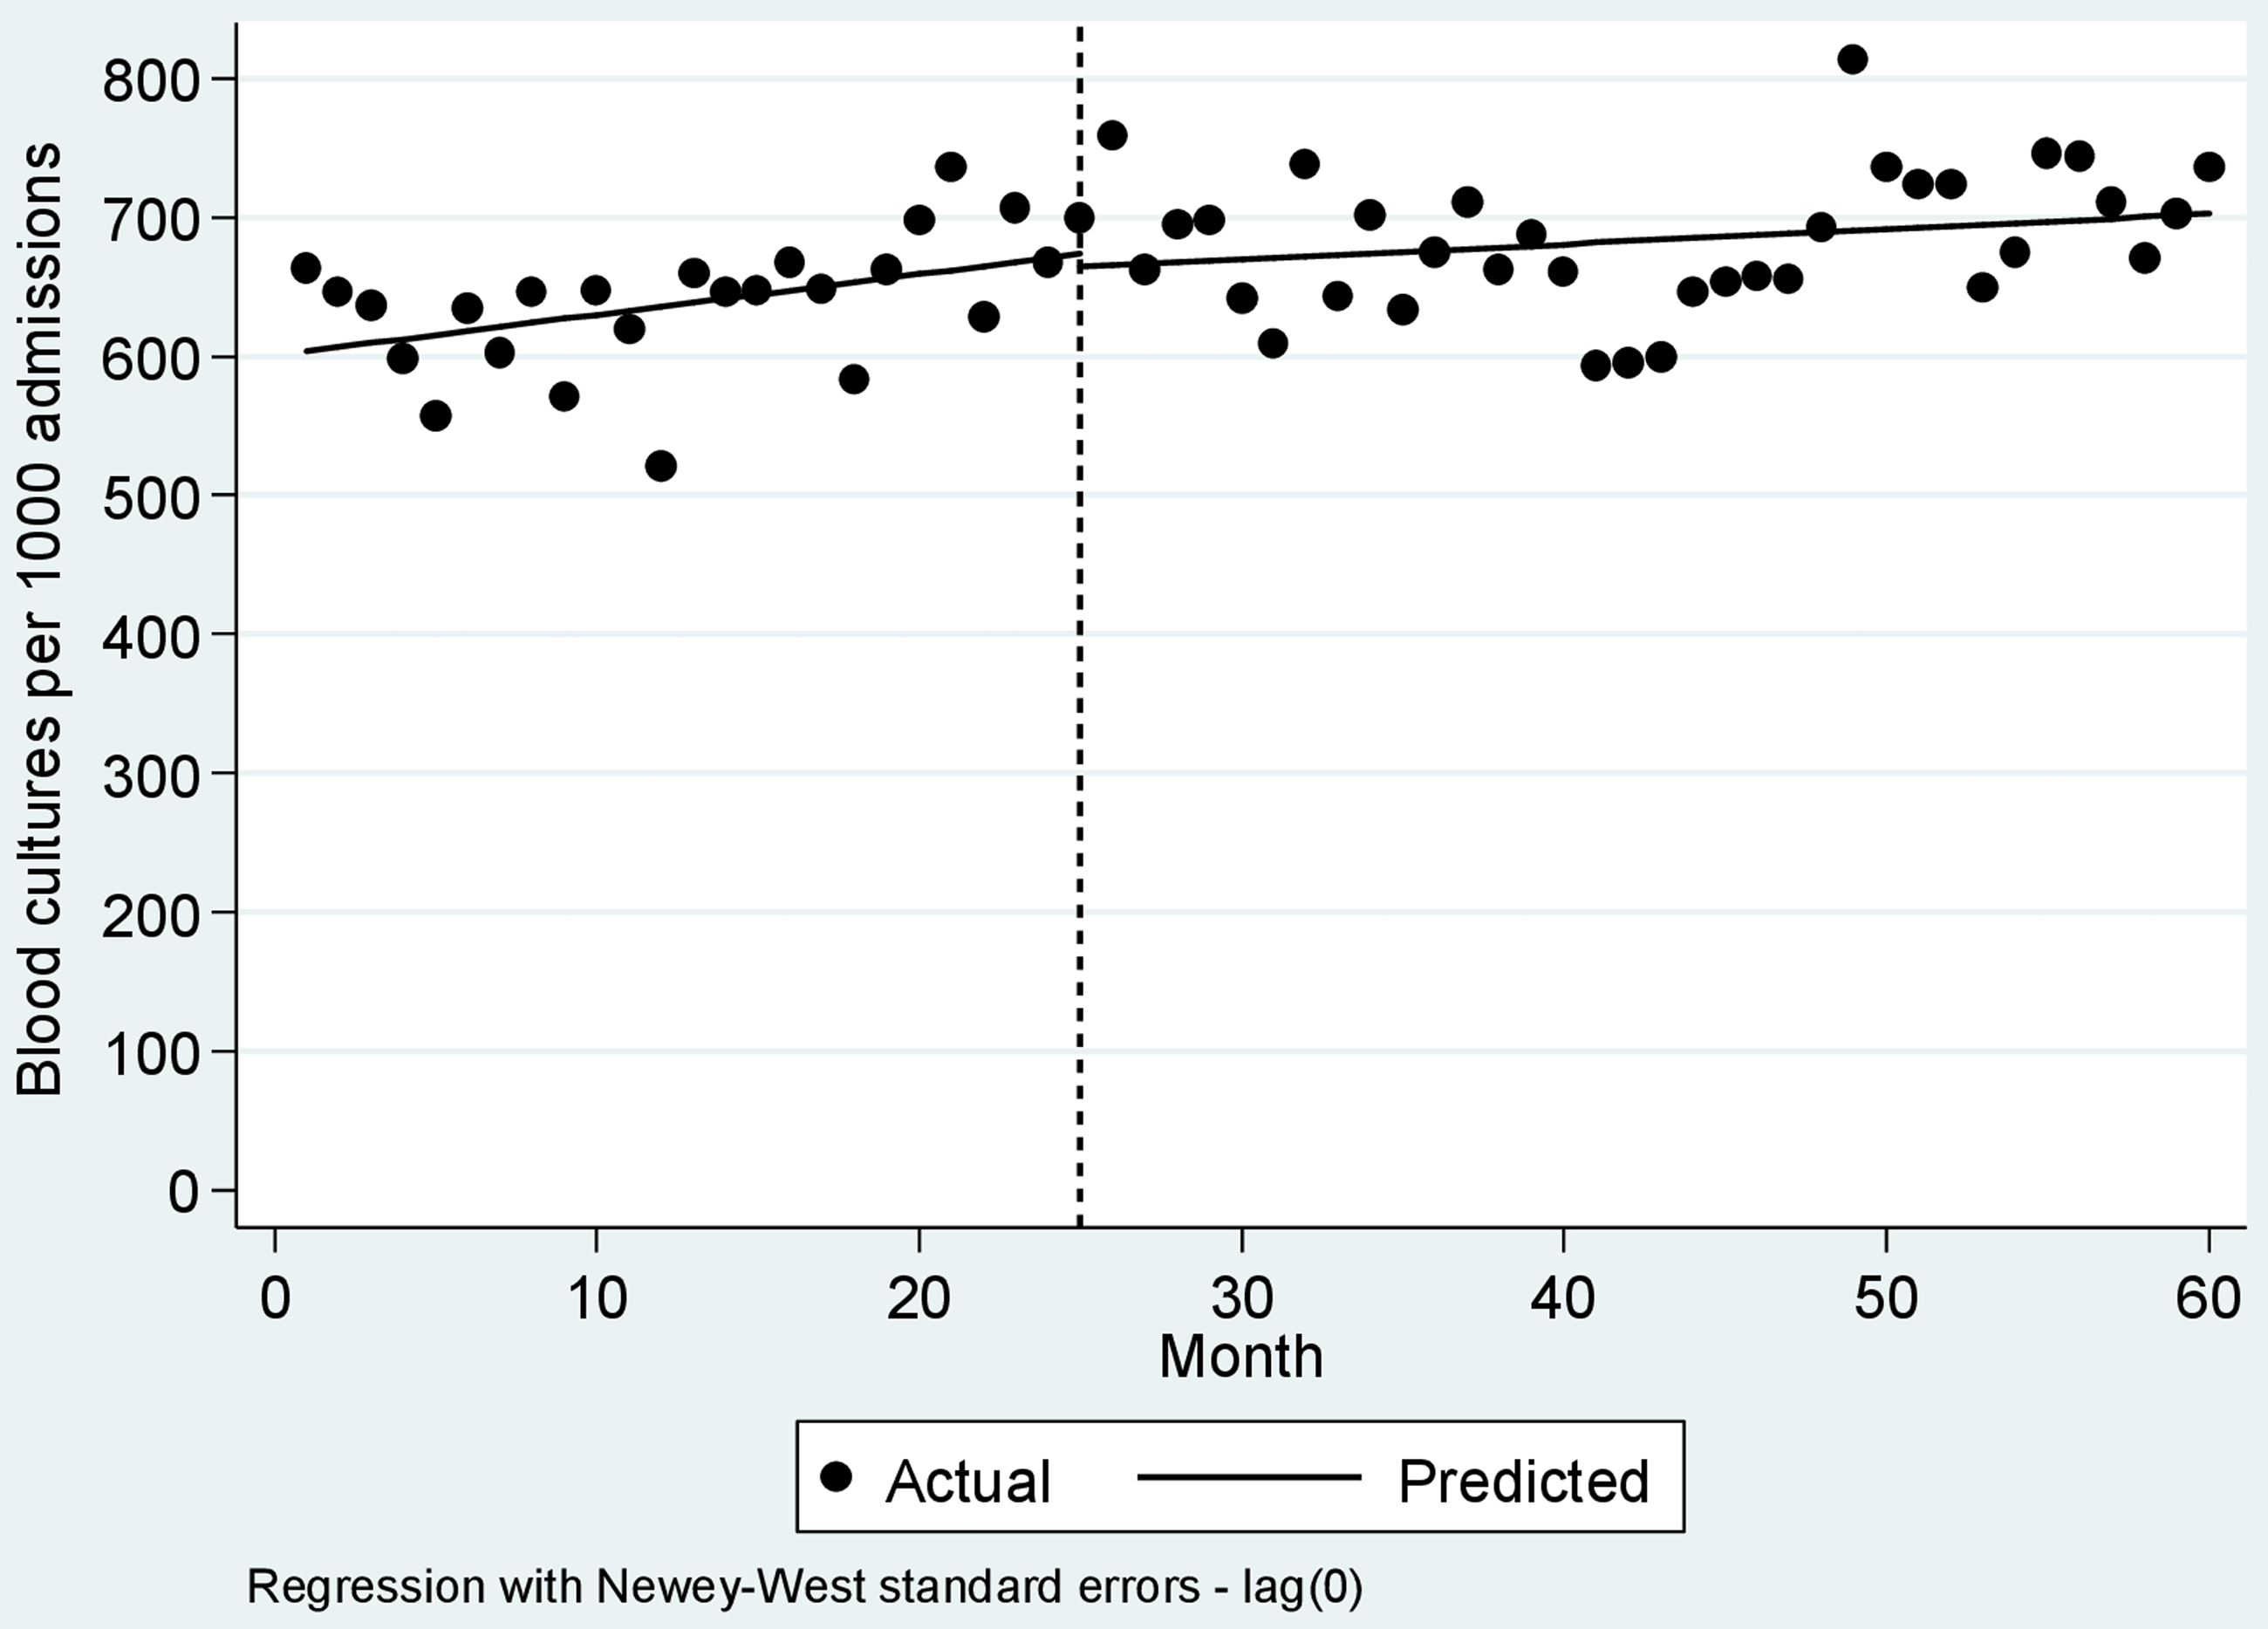
As shown in Figure 3, in the preintervention years, the NBSI rate per 1,000 admissions increased by 0.03 every month, but the increase was not significant (95% CI, −0.04 to 0.09; P = .40). Following a 4-month interval after the intervention was introduced, the NBSI rate per 1,000 admissions decreased significantly by 1.33 (95% CI, −2.58 to −0.07; P = .04). The monthly NBSI rate continued to decrease significantly by 0.03 during the intervention period (95% CI, −0.06 to −0.002; P = .03). In contrast, the rate of CO-BSI did not change significantly over the intervention period compared to the preintervention period. Figure 4 shows that during the intervention period, the monthly rate of blood cultures taken per 1,000 admissions increased nonsignificantly by 1.1 (95% CI, −0.32 to 2.51; P = .13).

Fig. 3. Interrupted time-series analysis of NBSI events before and during the intervention. The vertical dashed line separates the 24 months preintervention and the 36 months during the intervention. In the preintervention period, the NBSI rate per 1000 admissions increased by 0.03 per month (95% CI, −0.04 to 0.09; P = .40). Following a 4-month lag after introducing the intervention, the NBSI rate per 1,000 admissions decreased by 1.33 (95% CI, −2.58 to −0.07; P = .04). The monthly NBSI rate continued to decrease significantly by 0.03 during the intervention period (95% CI, −0.06 to −0.002; P = .03).

Fig. 4. Interrupted time-series analysis of blood-culture collection rate before and during the intervention. The vertical dashed line separates the 24 months before the intervention and the 36 months during the intervention. The blood-culture collection rate did not change significantly during the intervention period.
NBSI events were investigated in 909 (73%) of 1,237 events, with 99% correlation between NBSI definition according to the study protocol and the investigators’ conclusions. We compared NBSI rates that were calculated based on the expanded definition criteria of the study protocol (detailed in the Methods section) and those calculated based on the CDC definition only (acquisition after 72 hours of hospitalization). We detected an 85.6% correlation between them (P < .0001). Notably, our protocol identified 268 more events compared to those categorized using the CDC definition. In contrast, 52 events that were considered NBSIs according to the CDC definition were excluded after being investigated.
Microbiology profile
Most of the NBSI events before and after the intervention were caused by gram-negative bacteria (70% of isolated bacteria) (Table 2). Resistance to at least 1 antimicrobial agent was reported in 27% of bacteria, and extended-spectrum β-lactamase (ESBL) was the most common resistance mechanism among NBSIs (15%); MRSA was detected in only 3% of isolates (Table 2).
Comparison of bacteria that were isolated in NBSI events versus CO-BSI events and their resistant mechanisms is outlined in Table 1. Klebsiella spp, Pseudomonas aeruginosa, Staphylococcus aureus, Staphylococcus coagulase-negative spp, Enterococcus spp, and Candida spp isolates were more common among NBSI events. Furthermore, bacteria with any resistance mechanism were more common among NBSI events (27% vs 15%; P < .001) (Table 1).
Discussion
In this quality-of-care study, we evaluated the effects of instituting department-level investigations on the incidence of NBSI. The policy demonstrated a significant decrease in the incidence of NBSI events from 35.3% of total BSI before the intervention to 26.3% during 2016–2018, (P < .001); the NBSI rate per 1,000 admissions decreased by 1.33 (95% CI, −2.58 to −0.07; P = .04) after the intervention was introduced. These results highlight that self-investigations conducted by the patients’ personal healthcare providers are a beneficial tool, with an effect that lasted for the 3-year duration of the intervention.
The objectives of the intervention were to increase healthcare provider awareness of the magnitude and preventable risk factors of NBSI events in their departments, to implement the principle of a “never-event” in the hospital culture through constant investigations of recorded events, and to identify patients with a high potential for contracting NBSI, who require additional preventive strategies.
The importance of this study is 3-fold: (1) Implementing educational infection control interventions is challenging, time consuming and might have only limited, short-term effects. The results presented here indicate that self-investigations are an effective, simple to use, daily tool with long-lasting educational impact. If someone is personally investigating an NBSI event, the person might be motivated to implement the results of the investigation more efficiently. (2) Compared with NBSI surveillance studies, the results of the current study are based on prospective clinical investigations by healthcare providers. This analysis, conducted from the personal care providers’ point of view, provides reliable conclusions regarding the actual characteristics of hospitalwide NBSI in terms of rates of acquisition in each department, as well as NBSI sources, during a 3-year follow-up. (3) Because most published infection control interventions target ICUs, information on the impact of hospitalwide educational interventions is needed. Several studies addressed preventable risk factors for NBSI acquisition in hospitalwide settings in recent years; most were based on evaluations by infection control professionals. Reference Schrank, Sick-Samuels and Bleasdale10–Reference Yu, Ye and Edwards12 These findings bring a new perspective on the importance of including patients’ personal care providers (physicians and nurses without formal expertise in infection control activities) in the process of investigating NBSI events hospitalwide and daily, and they demonstrate self-investigation reduce NBSI rates.
Staff awareness is a crucial key for decreasing hospital-acquired infections. Periodic training sessions for healthcare personnel, nosocomial infection surveillance, department-specific notification of NBSI rates, and implementing technological solutions are all aimed at achieving this goal. 16–Reference Wisplinghoff, Bischoff, Tallent, Seifert, Wenzel and Edmond21 Yet, the challenge is to implement interventions with long-lasting effects. The intervention described here led to a continuous, daily educational process and recruited care providers throughout the hospital to be part of the ongoing mission to lower infection rates. An important strength of this intervention is its ongoing influence with sustained decreases in NBSI rates during a 3-year follow-up period.
Interrupted time-series analysis showed that the monthly NBSI rate decreased significantly after the intervention program was implemented. We believe that the relatively high percentage of investigations (73% of all investigations were completed), along with department-level exposure to quarterly data summaries, successfully increased staff awareness. Therefore, the incidence of NBSI events declined. Ongoing investigations led to timely identification of training gaps and infection clusters that produced specific interventions suited to each department’s needs; for instance, the results of this study identified CAUTI as the main source of NBSI events. The high rate of NBSI events that were reported outside ICUs in this study might explain why CAUTI was the main source of acquisition. The use of central lines outside ICUs is less frequent, while urinary catheter use is high, especially in internal medicine departments. Furthermore, the results highlighted peripheral-line infections as an important source of infection among non-ICU patients. After releasing the results of the investigation, procedures such as peripheral IV insertion and indications for urinary catheter were reviewed by the departments. These conclusions, drawn by the unit-based investigators, led to daily checks of the necessity for urinary catheter and peripheral vein lines in the relevant departments. We believe that these practice changes contributed to the reduction in NBSI rates, and we consider them an integral part of the intervention.
During the study period, routine infection control practices were implemented in the various departments, focusing on hand hygiene and monitoring acquisitions of resistant bacteria. We believe that these interventions did not contribute to the observed decline in NBSI rates because these practices did not change before or after the intervention. Also, Figure 4 shows that the decrease in the NBSI rate could not be explained by avoiding blood cultures because during the intervention period, the monthly rate of blood cultures per 1,000 admissions increased nonsignificantly by 1.1 (95% CI, −0.32 to 2.51; P = .13).
Despite the high rate of NBSI among hospitalized patients outside ICUs, hospitalwide interventions are not reported often. Studies assessing the magnitude of hospital wide NBSI events are usually conducted by infection control teams and not by the patients’ personal care providers. Wisplinghoff et al Reference Correa and Pittet22 reported a hospitalwide NBSI rate of 60 per 10,000 patient days among 49 US hospitals over 7 years and reported that 49% of NBSI occurred outside ICUs, mostly in internal medicine departments. Reference Correa and Pittet22 Lyytikäinen et al Reference Lyytikäinen, Lumio, Sarkkinen, Kolho, Kostiala and Ruutu9 reported NBSI rates in 4 Finnish hospitals during a 2-year surveillance study and reported that 74% of events were in non-ICU patients. Reference Lyytikäinen, Lumio, Sarkkinen, Kolho, Kostiala and Ruutu9 In our cohort, the rate of non-ICU NBSI events was even higher, at 84% of events, and most were in internal medicine departments (Fig. 1 and Table 2). The high rates of non-ICU NBSI events emphasize the need for studies focusing on hospitalwide intervention programs.
The literature does not address positive blood cultures that were drawn soon after discharge or after a recent in-hospital procedure. We considered these events as NBSIs because we believe they represent true exposure to nosocomial flora that might lead to NBSI acquisition. Data were analyzed for NBSI according to the CDC definition separately (criterion 1 in the Methods section) to validate the suggested extended definitions of this study. We had a relatively high 85.6% correlation between the 2 definitions (P < .0001). The extended definitions revealed 268 additional events that were marked as NBSIs by care-team providers. While investigating these events, the investigators identified at least 2 clusters related to specific procedures (prostate biopsy and cardiac device implants) that led to root-cause analysis and directed interventions, such as improving preprocedural skin antisepsis, adding a new operating room, and conducting staff retraining. Hence, we believe that the criteria defined in this study might provide a more reliable overview of the true hospitalwide NBSI rates.
This study had several limitations. It took place in a single center. Only 73% of events were investigated and events before the intervention were investigated retrospectively, and some data were missing. Furthermore, the sources of the NBSI events were determined by care providers and did not always correlate with acceptable strict surveillance definitions. Nonetheless, we believe that the events that were investigated and included in the analysis reflected the true characteristics of NBSI in the different departments. The study did not include a “no-intervention” control group. Comparison to this type of group could strengthen the methodology and perhaps the results of the study.
In conclusion, NBSI events are prevalent among hospitalized patients. This hospitalwide intervention demonstrated that self-investigations of NBSI events conducted by care providers increased frontline ownership and staff awareness, improved understanding regarding true NBSI rates and characteristics, and resulted in a long-lasting decrease of NBSI rates throughout the hospital.
Supplementary material
To view supplementary material for this article, please visit https://doi.org/10.1017/ice.2023.15
Acknowledgments
We thank the infection-control entire team for their key contribution to the intervention. We also thank Faye Schreiber, MS for editing the manuscript. She is an employee of Meir Medical Center.
Financial support
No external sources of funding were needed to support this work.
Conflicts of interest
There are no financial or other relationships that might lead to a conflict of interest among all authors.


