Introduction
Cardiac hypertrophy, commonly seen as a compensatory mechanism, enables the heart to maintain its function under mechanical stress or neurohormonal stress. Reference Gélinas, Mailleux and Dontaine1 However, sustained overload causes various heart diseases, such as myocarditis, coronary heart disease, endocarditis, heart failure, and even sudden death. Reference Cohn2,Reference Deng, Zhao and Wang3 Great efforts have been made to identify genes and signalling pathways associated with this disease. Nevertheless, there is a continual need to discover new regulatory mechanisms for cardiac hypertrophy.
Long non-coding RNAs (lncRNAs), which act as a member of transcribed Ribonucleic Acid (RNA) molecules with more than 200 nucleotides, are increasingly recognised for their involvement in multiple cardiovascular diseases, Reference Piccoli, Gupta and Viereck4 including cardiac hypertrophy. Reference Wang, Liu and Zhou5 LncRNAKCNQ1OT1 has been reported to regulate myocardial infarction. Reference Li, Dai and Yan6 Nevertheless, the specific effect of lncRNAKCNQ1OT1 in cardiac hypertrophy is still unclear.
MicroRNAs, small non-coding RNAs, are known to induce messenger RNA degradation. Reference Ying, Riopel and Bandyopadhyay7 MicroRNAs play crucial roles in a wide variety of biological processes, such as cell proliferation and apoptosis. Reference Liu, Jian, Qi and Mao8– Reference Yu and Zhong10 The contribution of microRNAs to cardiac hypertrophy is well-documented. MiR-1, for instance, can mitigate cardiac hypertrophy induced by thyroid hormone. MiR-146a acts as a suppressor in cardiac hypertrophy, as well as miR-206. Reference Diniz, Lino, Moreno, Senger and Barreto‐Chaves11 Reference Yang, Del Re and Nakano–13 MiR-301b, implicated in the development of various diseases, regulates the proliferation of bladder cancer cells by targeting specific genes. Reference Yang, He and Wang14 Isoliquiritigenin inhibits miR-301b and thus inhibits human melanoma growth. Reference Xiang, Chen and Luo15 Recent studies showed that miR-301b participates in the regulation of diabetic heart diseases by inhibiting adenosine monophosphate (AMP) deaminase. Reference Tatekoshi, Tanno and Kouzu16 However, the potential function of miR-301b in cardiac hypertrophy remains unclear.
With targetscan software, this study has predicted that transcription factor 7 (Tcf7) might be the target gene of miR-301b. Tcf7, a member of the T cell factor family, is known for its extensive involvement in various cancers. Reference Liu, Sun and Zhang17,Reference Xu, Liu, Tian, Xu and Chen18 Furthermore, Tcf7 has been confirmed to participate in the cell cycle regulation of cardiomyocyte. Reference Ye, Li, Xu, Chen and Li19 The impact of Tcf7 in cardiac hypertrophy, however, is rarely reported. The Wnt signalling pathway, to which Tcf7 belongs, has been identified as regulating the end-stage of hypertrophic cardiomyocytes, leading to variations in cardiac hypertrophy and left ventricular structure and function. Reference Cingolani20 Other studies have reported that c-myc, a downstream target gene of Tcf7, was activated during cardiac hypertrophy. Reference Olson and Ledee21 Collectively, it was speculated that Tcf7 may also take part in the regulation of cardiac hypertrophy as a member of Wnt signalling pathway.
In summary, this study aims to confirm whether lncRNAKCNQ1OT1, miR-301b, and Tcf7 impact cardiac hypertrophy, and to delve into the latent relationship in this context. Thus, the mentioned findings may be conducive to providing potential therapeutic targets and strategies for cardiac hypertrophy treatment.
Materials and methods
Cardiac hypertrophy animal model
Male C57BL/6 mice, aged 8–10 weeks and weighing 22–25 g, were anaesthetised by intraperitoneal injection of 1% sodium pentobarbital. After the anaesthesia, tracheal intubation was performed in mice, and breathing was regulated by ventilator (frequency: 90–100 times/min, tidal volume: 0.4-0.5 mL). The supine position of mice was fixed on the thermostat pad of the operating table (30°C). The operation area was cleaned. The skin was cut in the middle of the chest, up to the superior sternal fossa and down to 0.3 cm after the right carotid artery was separated. 26G pad needle (0.4 mm in diameter, self-made) was employed to ligate the aorta and pad needle (causing nearly 70% stenosis). After the ligation, the pad needle was pulled out, and the aortic arch was examined. The fluctuation of proximal end was facilitated, the chest was closed layer by layer, while the skin was sutured. After 4 weeks, cardiac hypertrophy was evaluated by echocardiography, covering thickness of anterior and posterior walls of the left ventricular (left ventricular anterior wall thickness and left ventricular posterior wall depth), fractional shortening and ejection fraction. The ratios of heart weight to body weight were also measured. The guideline issued by the United States of America National Institutes of Health (NIH) was rigorously followed and approved by the Experimental Animal Ethics Committee of Baicheng Medical College.
Haematoxylin-eosin staining
Male C57BL/6 mouse’s left ventricle was incubated into 4 g/L paraformaldehyde solution overnight and subsequently transferred to 30% sucrose solution. The tissue was knifed and placed on slides. Next, the Haematoxylin-eosin staining was employed to stain these sections and the pathological variations of myocardial tissue were observed. Afterwards, Olympus BX60 microscope was used to capture photographs.
Neonatal mouse cardiomyocyte culture
According to the study, the hearts of C57BL/6 mice aged 1–3 days were quickly removed and washed with 0.9% cold phosphate buffer saline. Then, the ventricular tissue was crushed and hydrolysed by 0.25% trypsin (Beyotime, China). Reference Liang, Pan and Zhao22 The collected cell suspension was centrifuged and then suspended in dulbecco's modified eagle medium (DMEM) supplemented by 10% fetal bovine serum. Next, myocardial cells were purified by selective adhesion of non-cardiac cells with 90 min pre-plating interval. Cells, which attached weakly, were regarded as cardiomyocytes. Afterwards, 5-bromo-2-deoxydriuine (Brdu,0.1 mmol/L, Sigma, America) was used to inhibit myocardial fibroblast proliferation. To induce hypertrophy, 100 nmol/L Angiotensin II (Ang II) was added to the cardiomyocyte for 48 hours.
Transfection procedures
According to the manufacturer’s protocol, cells were washed with serum-free medium and then incubated in 4 mL of serum-free medium for 4–6 h. The constructs and X-tremeGENE transfection reagent were transfected to myocardial cells. miR-301b complied with the sequence of 5’-GCUCUGACUAGGUUGCAGUACU-3’. Antisense miRNA oligonucleotides (AMO)-301b: 5’-AGUAGUGCAACCUAGUCAGAGC-3’. N.C: (5’-UUCUCCGAACGUGUCACGUTT-3’), AMO-N.C: 5’-CAGUACUUUUGUGUAGUACAA-3’.
Tcf7 silencing
Cells were transferred to 6-well plates and incubated for 48 h. According to the instruction, siRNA was used to silence Tcf7. Tcf7-siRNA sequence was 5’-GGAAGAGAGGACAAGGAAUTT-3’. Tcf7-sc:5’-UUCUCCGAACGUGUCACGUTT-3’. The sequences were synthesised by GenePharma Co.
Western blot
Radio-Immunoprecipitation Assay (RIPA) buffer was used to lyse cardiac tissues and myocardial cells. Sodium dodecyl sulfate (SDS)-polyacrylamide gel was used to fractionate protein sample with 60 μg. Following electrophoretic, the protein transfers onto a nitrocellulose blotting membrane. β-actin was regarded as an internal control. β-myosin heavy chain (β-MHC) antibodies (1:2000) and Brainnatriureticpeptide (BNP) antibodies (1:500) were, respectively, purchased by Sigma and Santa Cruz Biotechnology. Tcf7 antibody (1:200) and c-myc antibody (1:500) were offered by Abcam. Membranes were incubated at 4°C overnight. After that, membranes were cleaned by Tris Buffered Saline with Tween-20. Subsequently, secondary antibodies were used to incubate membranes for 1 h at ambient temperature. Lastly, the immunoreactivity was ascertained with an Odyssey Imaging System. Membranes were quantified by measuring the intensity.
Immunofluorescence staining
Phosphate buffer saline was used to wash myocardial cells. After that 4% paraformaldehyde was used to fix cells for 10 min. Next, the cells were permeabilized with 0.2% TritonX-100. α-SMA antibody was used to incubate cells at 4°C overnight. The non-specific binding of fixed cells was hatched at ambient temperature for 30 min with 5% BSA solution and then with anti-α-actin antibody (1:200; Beyotime, China) at 4°C overnight. Subsequently, Alexa Fluor™ 568-conjugated goat anti-mouse antibody (1:1000; Molecular Probes, Eugene, OR) was used to administrate cells at 37°C for 1 h. Lastly, 4',6-diamidino-2-phenylindole (DAPI) was adopted to affirm the nucleus. Fluorescence microscope was used to capture the photographs.
Quantitative RT-PCR
Trizol (Invitrogen, Carlsbad, CA) was employed to extract total RNA samples. To quantify the expression of microRNAs, the mirVana quantitative real time polymerase chain reaction (qRT-PCR) miRNA Detection Kit with SYBR Green I was used. Following 40 cycles reaction, threshold cycles (CT) were measured. Relative levels of microRNA were calculated in line with CT values. Meanwhile, GAPDH levels were normalised. Lastly, the 2–ΔΔCT method was employed for data analysis.
Luciferase assay according to gene sequence and vector characteristics, the 3’ untranslated region of Tcf7 gene that contains the restriction sites of HindIII and S peI enzymes were synthesised. Next, the pLG-3 plasmid and the 3’ untranslated region of Tcf7 were cut by HindIII and SpeI enzymes, and these two were connected by T4 ligase to form a new plasmid (pLG-3-promoter3’ untranslated region). Next, the constructed plasmids were transfected into human embryonic renal cell 293 (HEK293) cells according to the grouping. After 24 h, the DMEM was discarded and the culture dishes were washed with phosphate buffer saline. Then, culture dishes were shaken at room temperature for 15 min with 600 μL lysis solution added, these cell lysates were transferred to centrifugal tubes and put into high-speed centrifuge for 12 000 r/min, and after 30 s, the supernatant was transferred to other centrifugal tubes. In the light of established grouping, 100 μL LAR II and 20 μL cell lysates were added to measuring dishes and mixed evenly, then placed in spectrophotometer to obtain data. After that, add Stop & Glo 100 μL and mix evenly, read values, and record data.
Statistical analysis
The data are represented as mean ± standard error of mean (SEM) for a minimum of six independent experiments. Variance analysis was used for multiple groups. Two groups were compared by student’s t test. Meanwhile, p < 0.05 was regarded with statistical significance. SPSS 19.0 software and GraphPad Prism 7.0 were used to analyse the data.
Results
LncRNAKCNQ1OT1 is highly elevated in cardiac hypertrophy
Transverse aortic constriction and Ang II were used to build cardiac hypertrophy model in vivo and in vitro. As indicated in Fig 1a–f, left ventricular posterior wall depth, left ventricular anterior wall thickness and Heart weight (HW)/Body weight (BW) were increased in the model group compared to the control group, whereas left ventricular ejection fraction and left ventricular fractional shortening were reduced. Subsequently, Haematoxylin-eosin and immunofluorescence staining were used to detect the cell area, and found a significant increase in cell surface area (Fig 1g–h). Moreover, BNP and β-MHC, which are considered hypertrophy marker proteins, were significantly increased in hypertrophic models (Fig 1i–j). These results showed that we have built cardiac hypertrophy models successfully. Real-time PCR results indicated that the lncRNAKCNQ1OT1 level significantly increased in heart tissue and myocardial cell relative to cardiac hypertrophy (Fig 1k–l).
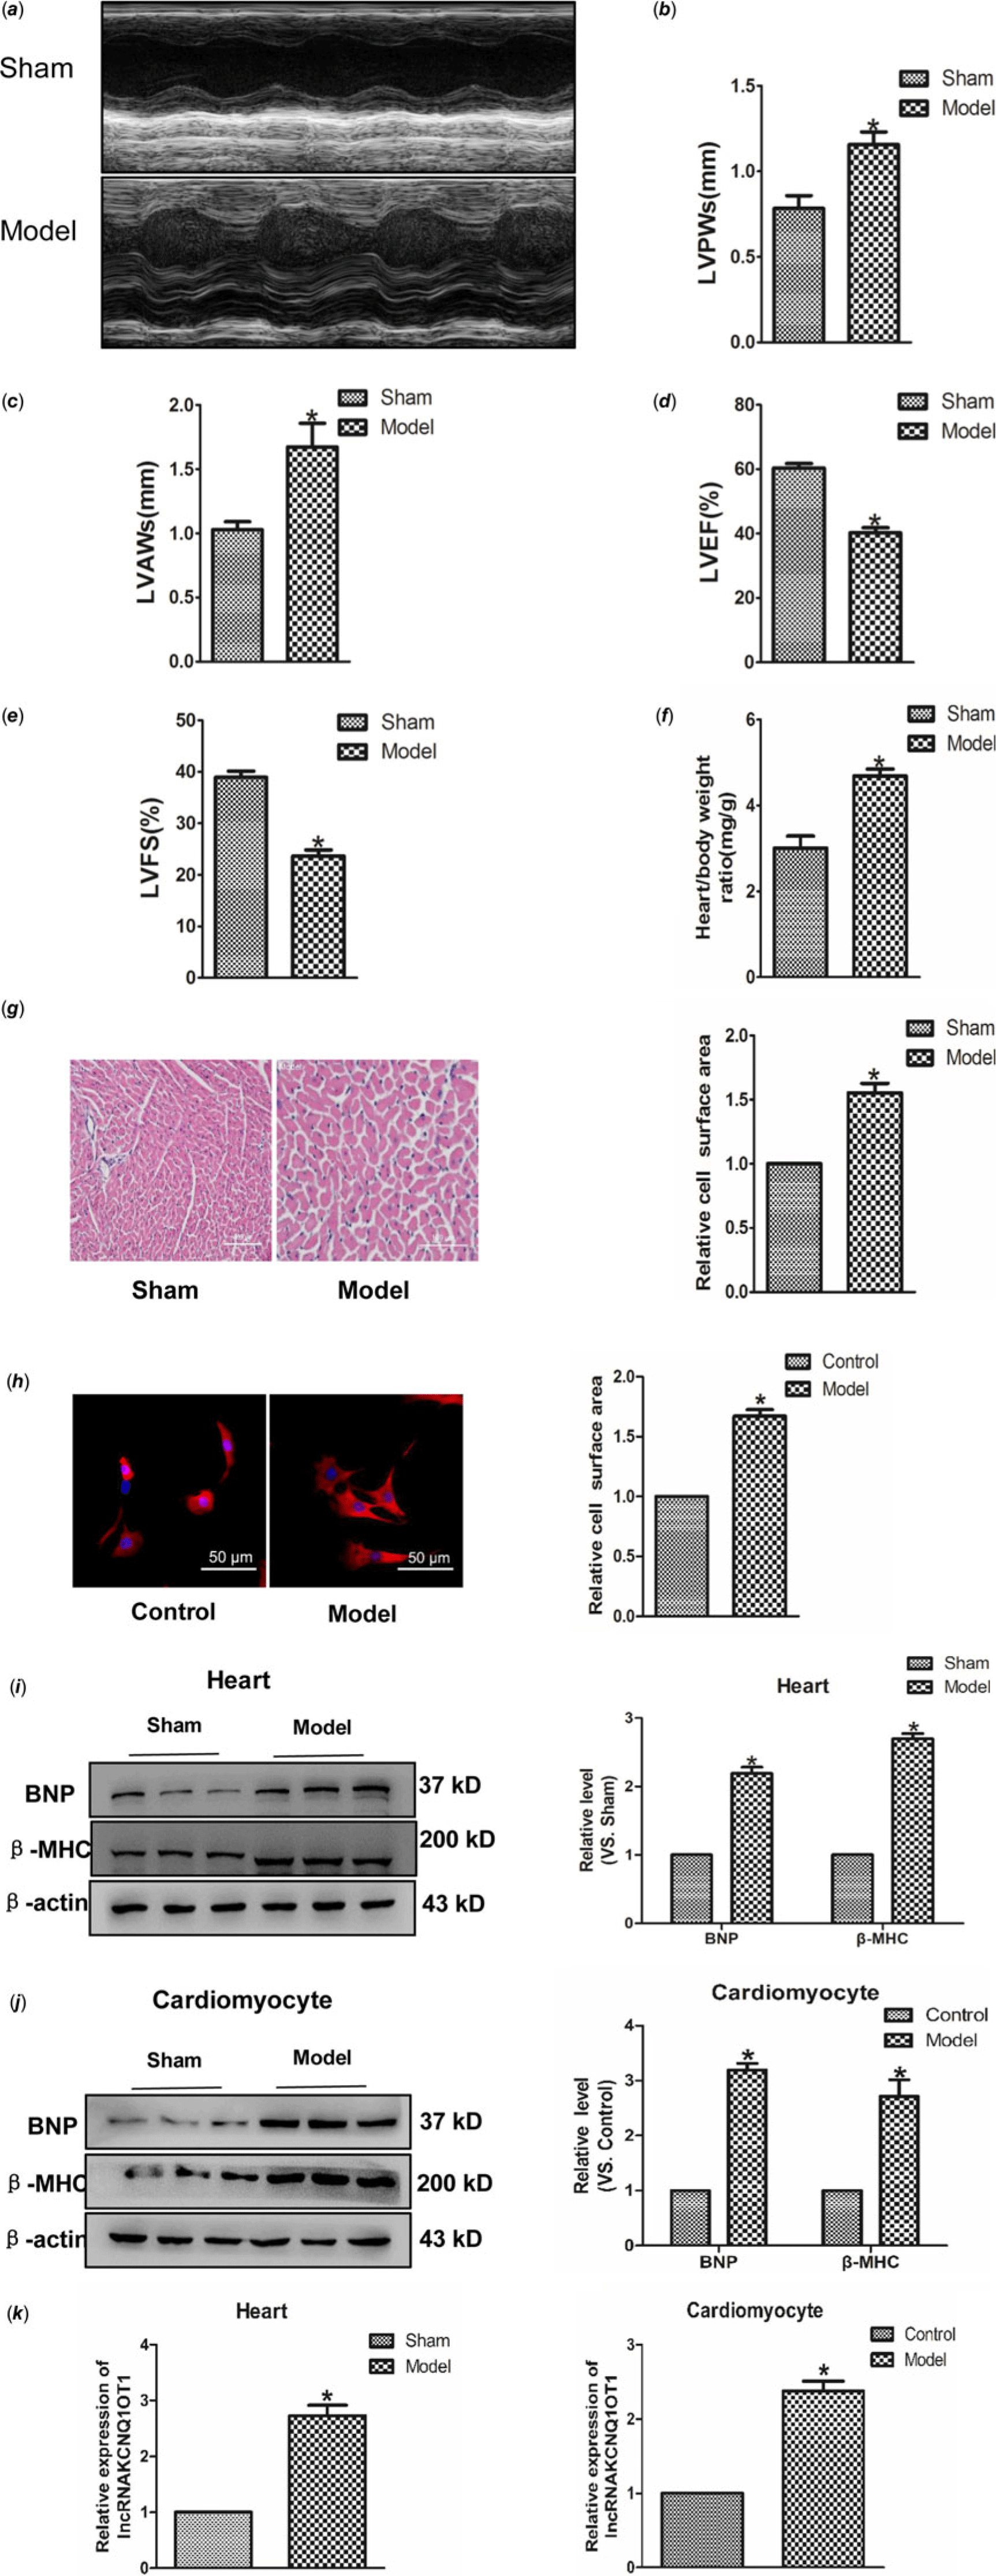
Figure 1. Increased expression of lncRNAKCNQ1OT1 in cardiac hypertrophy model (a) representative images of echocardiographic. Four weeks after transverse aortic constricted, echocardiographic imaging showed that level of left ventricular anterior wall thickness (b), left ventricular posterior wall thickness (c), left ventricular ejection fraction (d), and left ventricular fraction shortening (e). (f) the ratio of heart weight to body weight. (g) representative images of Haematoxylin-eosin staining (200×). (h) immunofluorescence staining with α-SMA antibody (200×). (i) BNP and β-MHC proteins level were detected in vivo. (j) BNP and β-MHC proteins level were detected in vitro. (k) LncRNAKCNQ1OT1 level was tested by real-time PCR analysis. (l) the expressions of lncRNAKCNQ1OT1 in vitro. Data were represented by mean ± SEM (n = 6). *p < 0.05 versus Sham or control group.
LncRNAKCNQ1OT1 effects in cardiac hypertrophy
In order to study whether KCNQ1OT1 affects the development of cardiac hypertrophy, we initially used siRNAs to repress lncRNAA02Rik expression. As displayed in Fig 2a, silncRNAKCNQ1OT1 alleviated the Ang-II-induced increase in cardiomyocyte surface area. Western blot results showed silncRNAKCNQ1OT1 could repeal the increased expression of BNP and β-MHC. Conversely, lncRNAKCNQ1OT1 overexpression led to an increase in the surface area of cardiomyocytes (Fig 2c), along with elevated levels of β-MHC and BNP proteins (Fig 2d). Collectively, these findings indicating lncRNAKCNQ1OT1 acts as a contributor to cardiac hypertrophy.
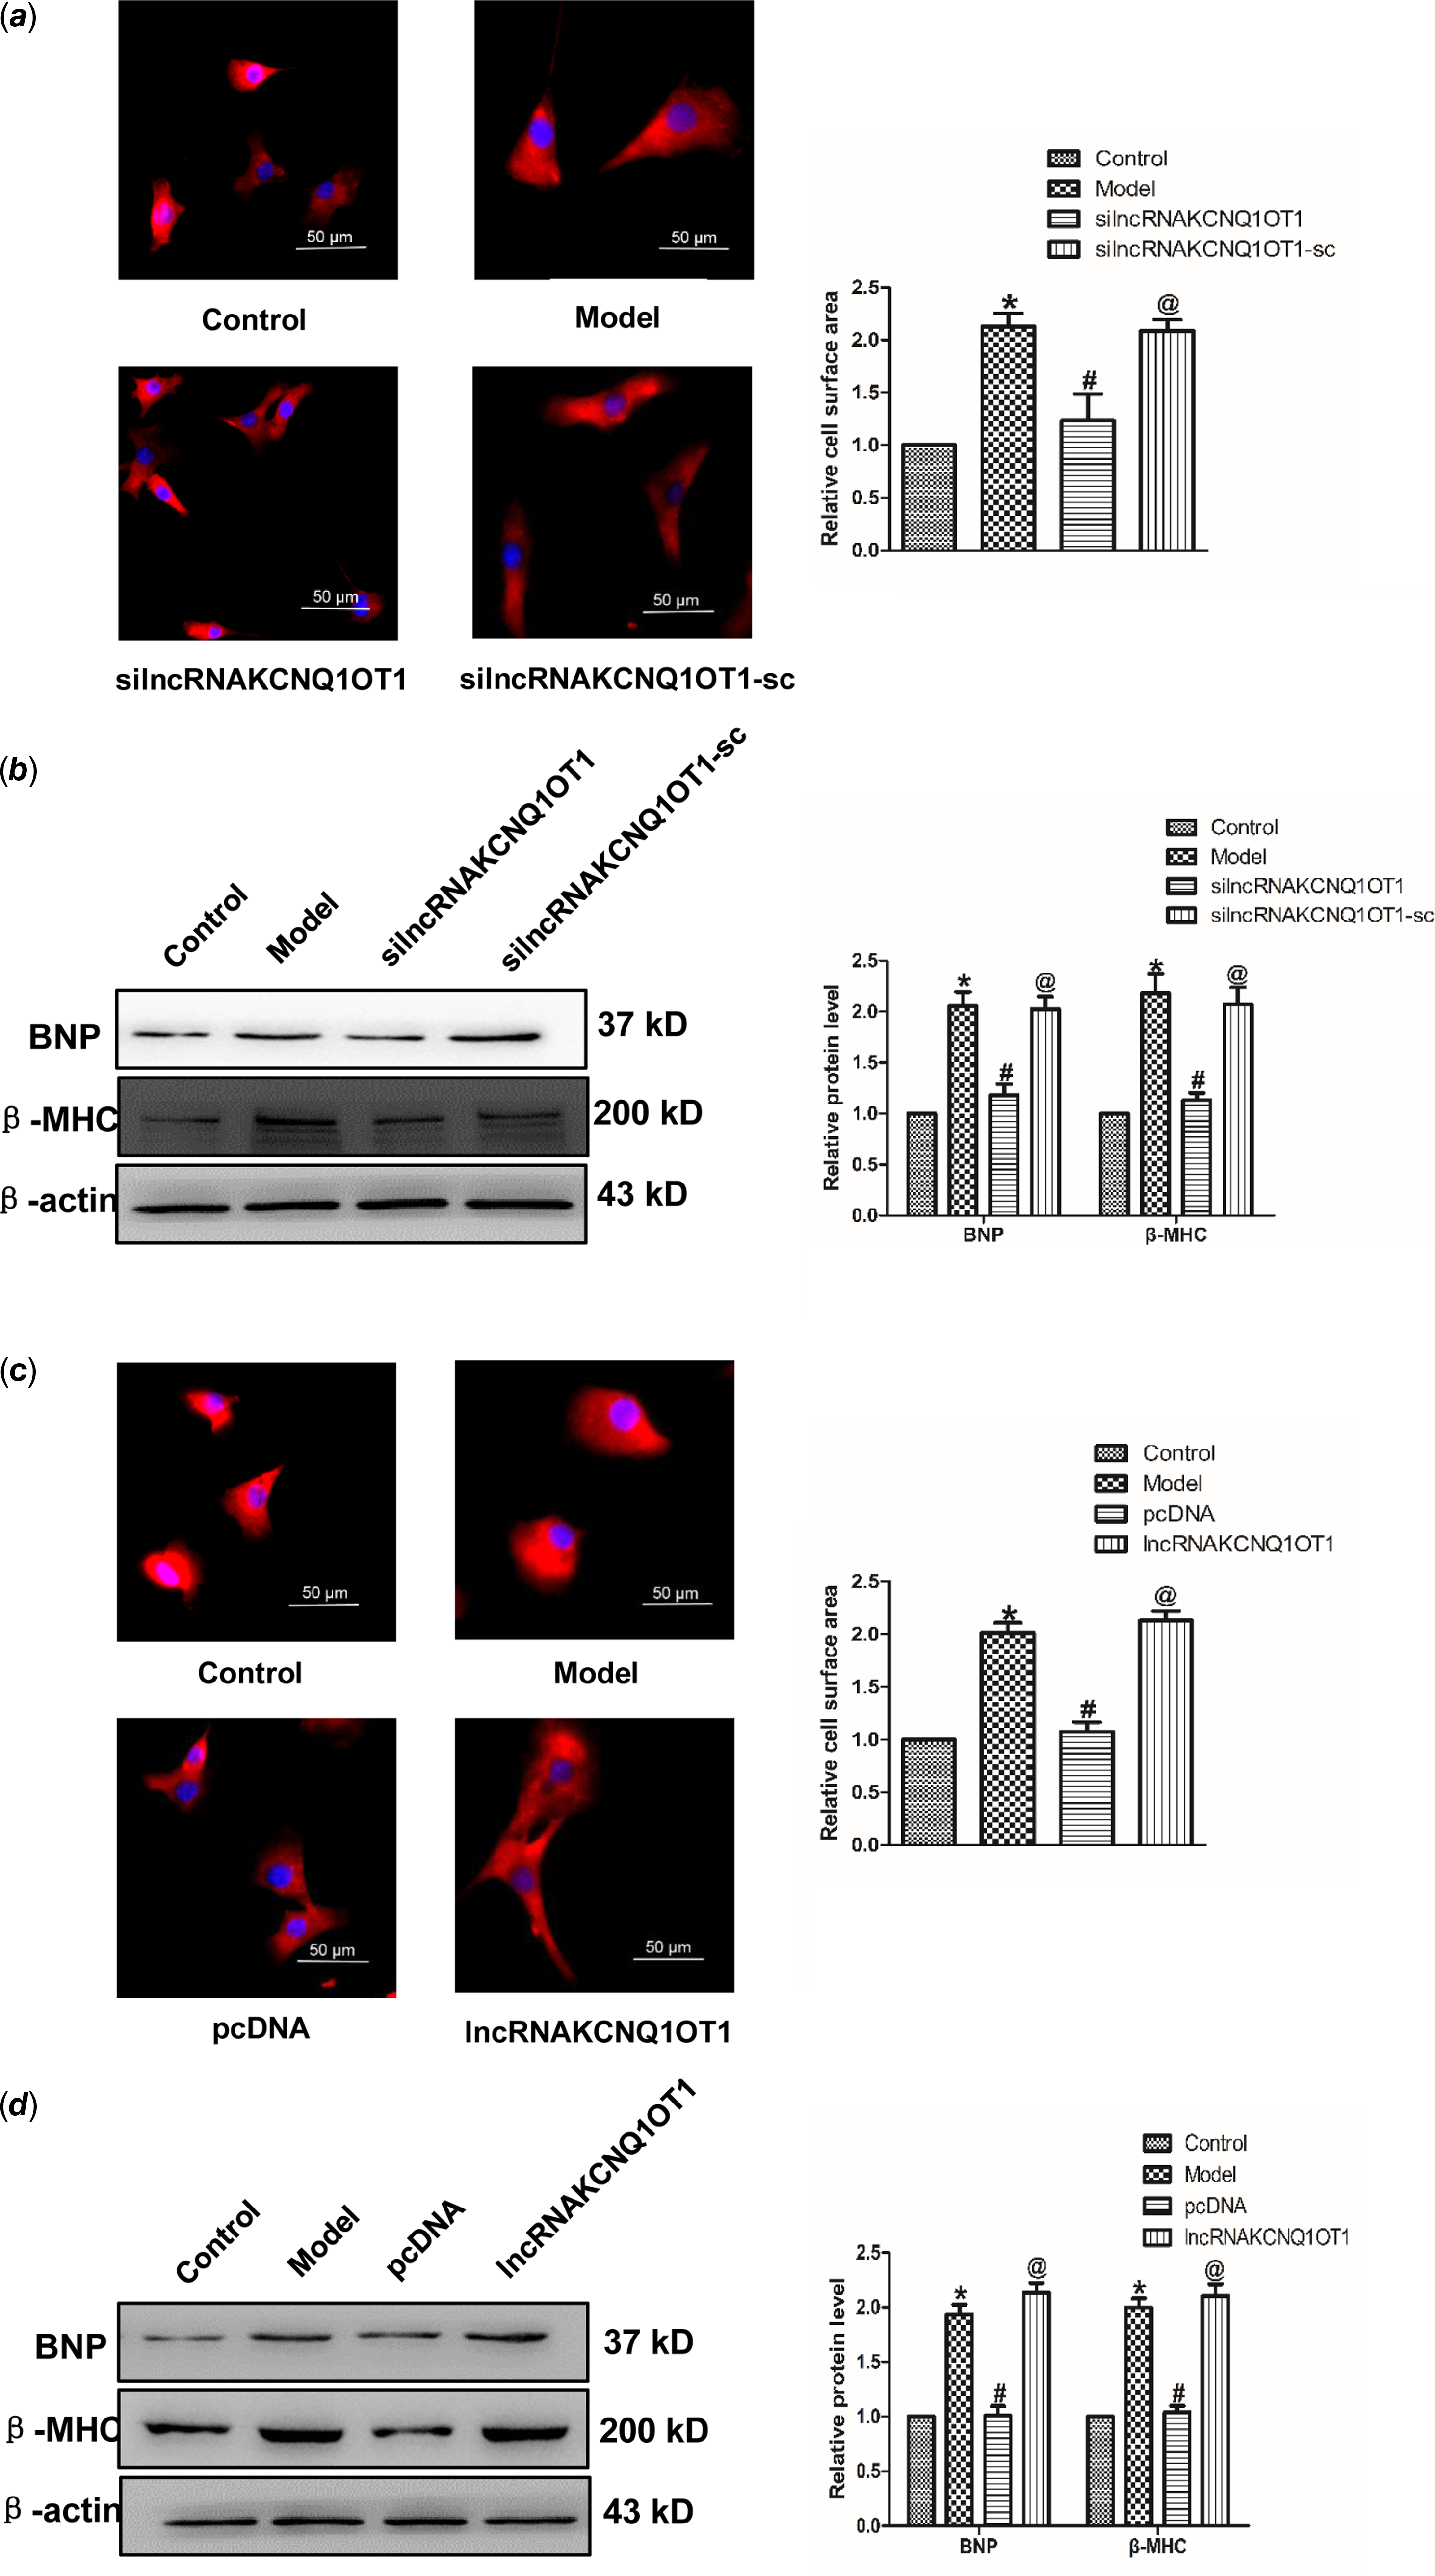
Figure 2. lncRNAKCNQ1OT1 contributes to cardiac hypertrophy (a) immunostaining with α-SMA in cardiomyocytes displayed that knockdown of lncRNAKCNQ1OT1 decreased the cell surface area. Bar = 50 μm. (b) β-MHC and BNP proteins expression by lncRNAKCNQ1OT1 knockdown. (c) immunostaining of α-SMA in cardiomyocytes demonstrated that enhanced expression of lncRNAKCNQ1OT1 promoted the cell surface area. Bar = 50 μm. (d) Western blot results of β-MHC and BNP proteins expression by lncRNAA02Rik overexpression. Mean ± SEM was used to identify the date (n = 6). *p < 0.05 versus control group; # p < 0.05 versus model group. @p < 0.05 versus pcDNA group.
MiR-301b inhibits cardiac hypertrophy
To ascertain the role of miR-301b in cardiac hypertrophy, real-time PCR was used to test the expression of miR-301b in mice myocardial tissues and neonatal cardiomyocytes. As shown in Fig 3a and b, the level of miR-301b was lower in model group compared with control group considerably, suggesting a potential involvement of miR-301b in myocardial hypertrophy. In order to detect the role of miR-301b in cardiac hypertrophy, we further overexpressed miR-301b in sham and model mice, respectively. Five-week-old mice were infected with AAV9–miR-301b or with an equivalent volume of phosphate buffer saline (Fig 3d), after 3 weeks, they were subjected to transverse aortic constricted or Sham (Fig 3d). Subsequently, HW/BW, left ventricular posterior wall depth and left ventricular anterior wall thickness were decreased, whereas left ventricular ejection fraction and left ventricular fractional shortening were up-regulated in the model with Adeno-associated virus (AAV)-miR-301b group (Fig 3e–h). Meanwhile, miR-301b overexpression significantly narrowed the cell surface area induced by transverse aortic constricted (Fig 3i), and decreased the expression of BNP and β-MHC, as compared with model group (Fig 3j). Consistent with these findings, the overexpression of miR-301b was used on neonatal mouse primary cardiomyocytes (Fig 3k). MiR-301b overexpression diminished the enhancement of cell surface areas and β-MHC and BNP level, induced by Ang-II (Fig 3l–n), and these works were suppressed by AMO-301b. Overall, these results demonstrated that miR-301b exerted an anti-hypertrophic role.

Figure 3. The role of miR-301b in cardiac hypertrophy (a) miR-301b expression in vivo model. *p < 0.05 versus sham. (b) miR-301b expression in vitro model. *p < 0.05 versus model. (c) miR-301b expression measured by real-time PCR. (d) LVPWs: left ventricular posterior wall depth. (e) LVAWs: left ventricular anterior wall thickness. (f) LVEF: left ventricular ejection fraction. (g) LVFS: left ventricular fractional shortening. (h)The ratio of heart weight to body weight. (i) representative images of Haematoxylin-eosin staining (200×). (j) BNP and β-MHC proteins expression. *p < 0.05 versus sham-AAV-miR-301b group; # p < 0.05 versus model group. (k) miR-301b expression measured by real-time PCR. (l) immunofluorescence staining with α-SMA antibody. Bar = 50 μm. (m) BNP protein expression. (n) β-MHC protein expression. Mean ± SEM was used to analysis the date (n = 6). *p < 0.05 versus control group; # p < 0.05 versus model group; @p < 0.05 versus miR-301b group.
Tcf7 effects in cardiac hypertrophy
This study aimed to identify whether Tcf7 take part in the progress of cardiac hypertrophy. In vivo experiments revealed a significant upregulation of Tcf7 expression in the model group. Consistent with this finding, the expression of c-myc protein also markedly higher in the model group, compared with the normal group (Fig 4a). Similar results have been achieved in vitro experiments (Fig 4b). Further, in order to verify the effect of Tcf7 in cardiac hypertrophy, the expression of Tcf7 was successfully inhibited suing targeted siRNA (Fig 4c–d). Subsequent results showed that silencing Tcf7 distinctly narrowed cell surface area (Fig. 4e). Meanwhile, BNP and β-MHC levels were also decreased on the effect of siTcf7, compared with the model group. The c-myc expression was also down-regulated under these conditions (Fig 4f). In brief, these results suggested activation of Tcf7 might facilitate cardiac hypertrophy by activating c-myc.
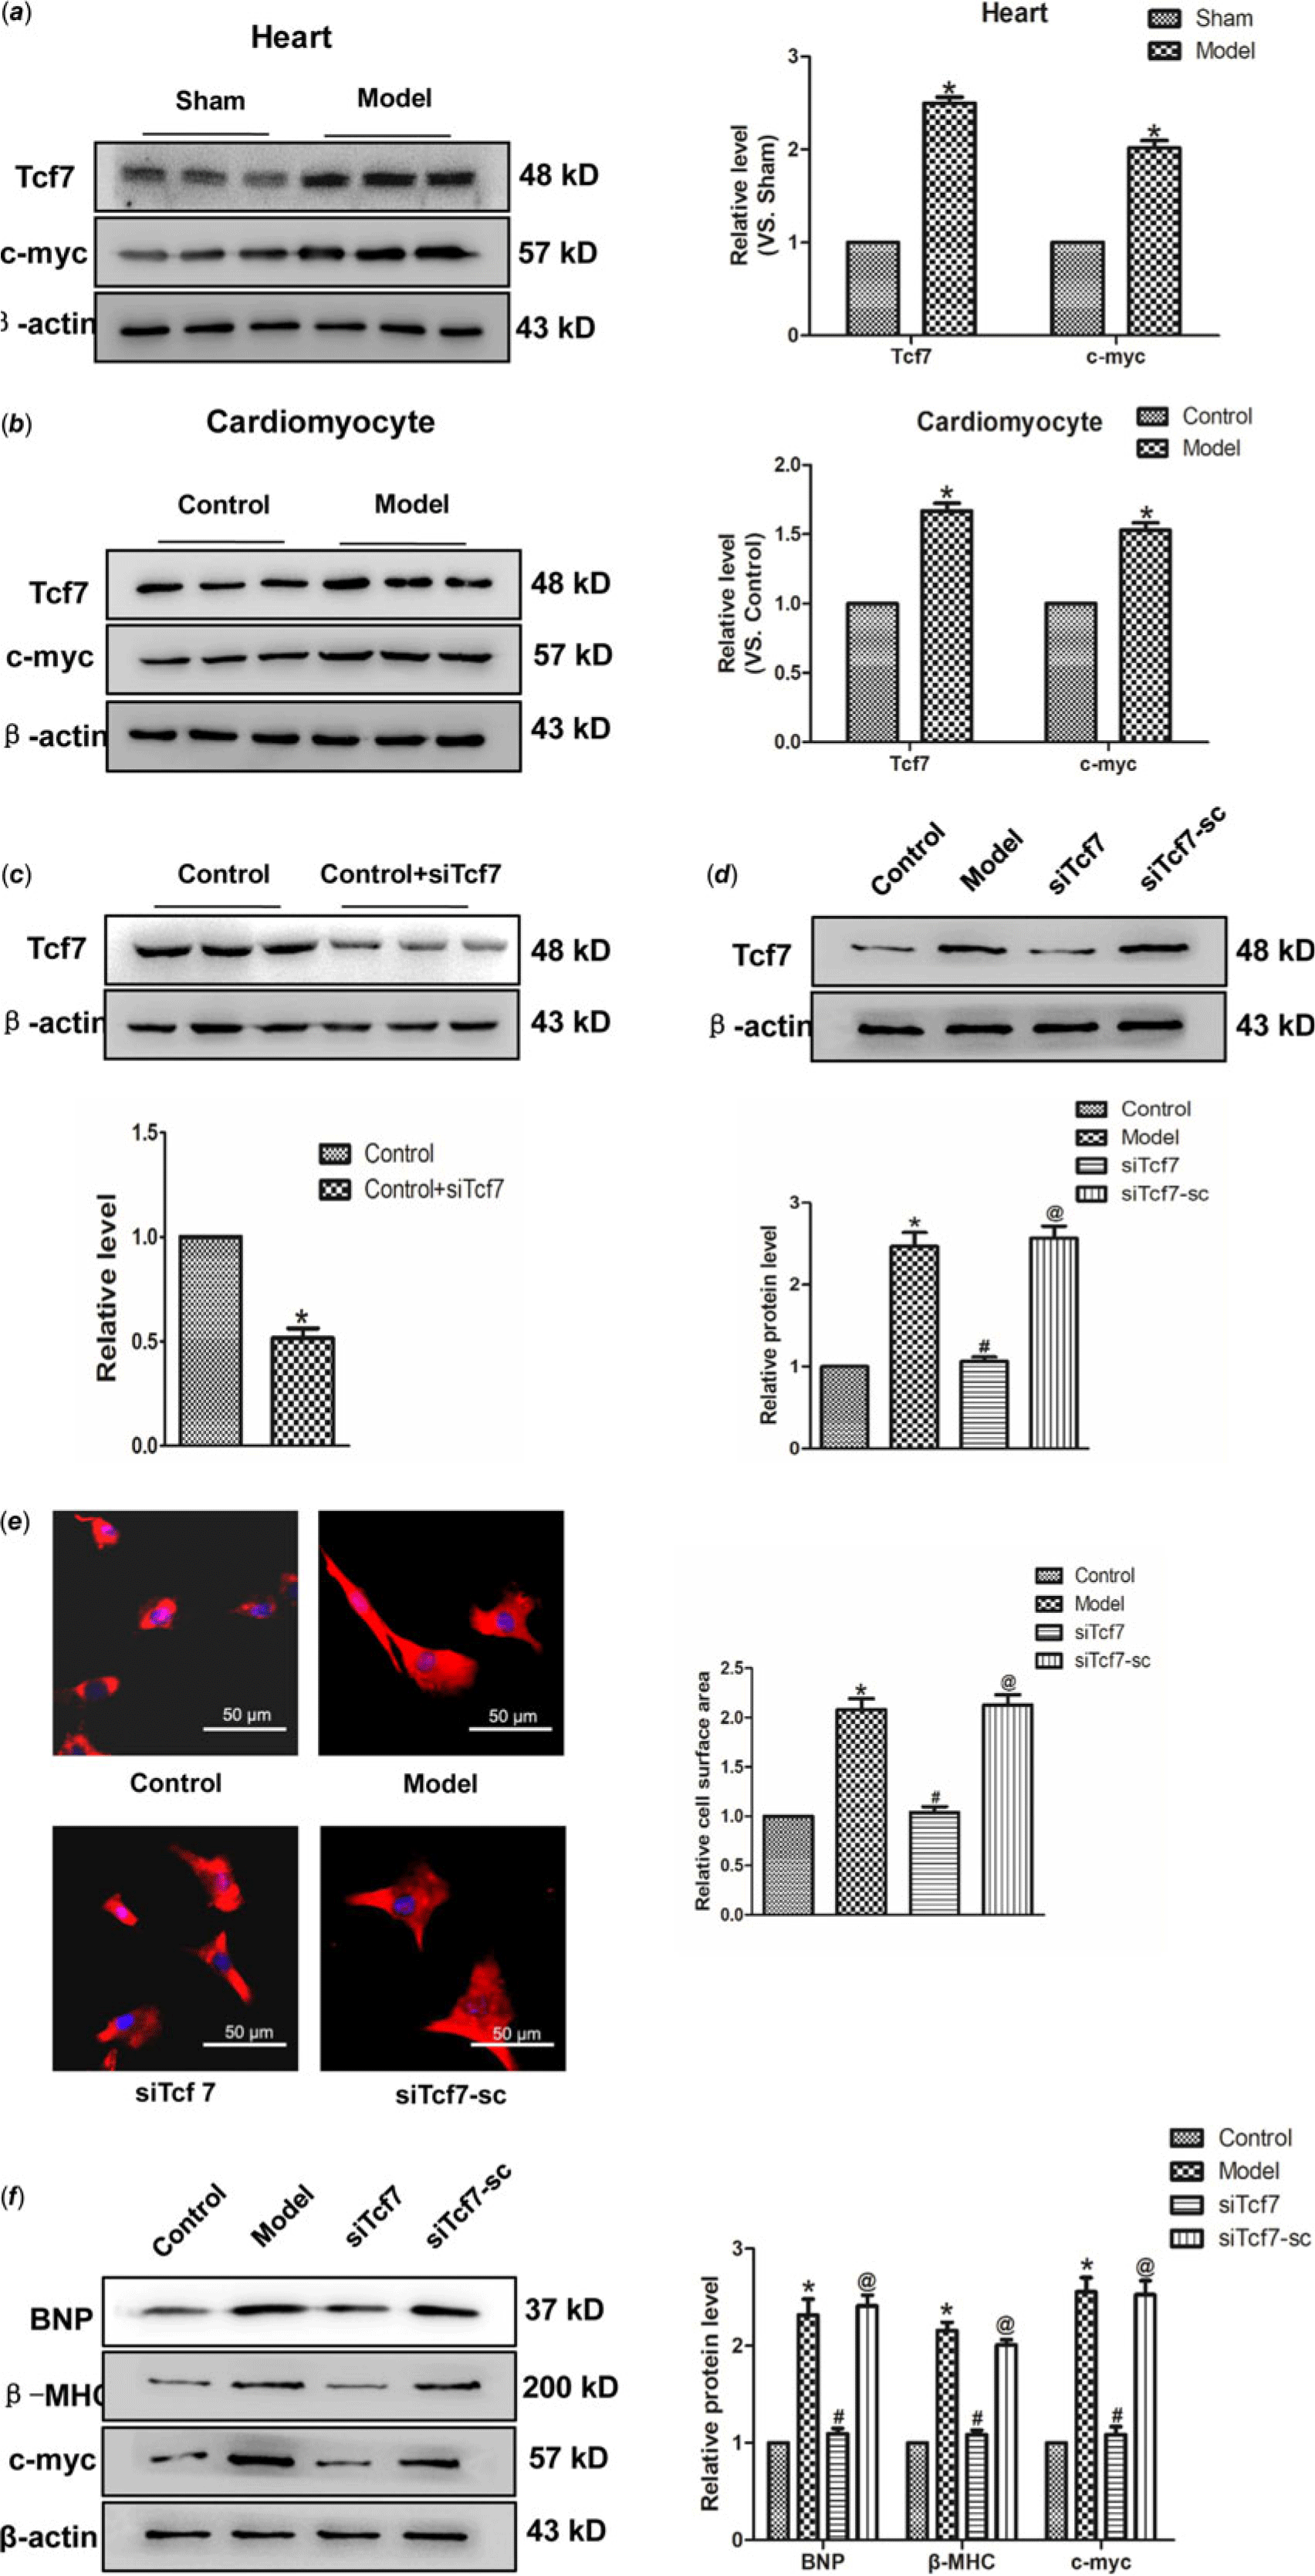
Figure 4. The activation of Tcf7 promoted cardiac hypertrophy (a) Tcf7 and c-myc proteins expression in vivo. (b) the expressions of Tcf7 and c-myc proteins were measured in vitro. (c and d) Tcf7-siRNA successfully silenced Tcf7. (e) Si-Tcf7 decreased cardiomyocytes surface area induced by Ang II (×200). (f) BNP, β-MHC and c-myc proteins expression were decreased by si-Tcf7 induced by Ang II. Mean ± SEM was used to analysis data. (n = 6) *p < 0.05 versus control group; # p < 0.05 versus model group; @p < 0.05 versus siTcf7 group.
Tcf7 acts as a target of miR-301b
Targetscan software analysis identified Tcf7 was a target of miR-301b. Accordingly, the role of miR-301b on Tcf7 with the AAV-miR-301b in vivo was studied. As suggested from the results, the protein expression of Tcf7 and c-myc was down-regulated in model with AAV-miR-301b group, compared with model group (Fig 5a). Meanwhile, Tcf7 and c-myc level was decreased by miR-301b over-expressing, and they were up-regulated when miR-301b was inhibited, in contrast to the control group (Fig 5b–c). Likewise, in order to detect whether Tcf7 was the target of miR-301b, the luciferase activities were performed (Fig 5d). The findings revealed that co-overexpression of wild-type Tcf7 3’- untranslated region and miR-301b significantly reduced the luciferase activity of Tcf7 3' untranslated region. In contrast, the activity of the mutant Tcf7 3' untranslated region remained almost unchanged upon miR-301b over-expression. Collectively, these data indicated that miR-301b can directly bind to the 3' untranslated region of Tcf7 to suppress its activity.
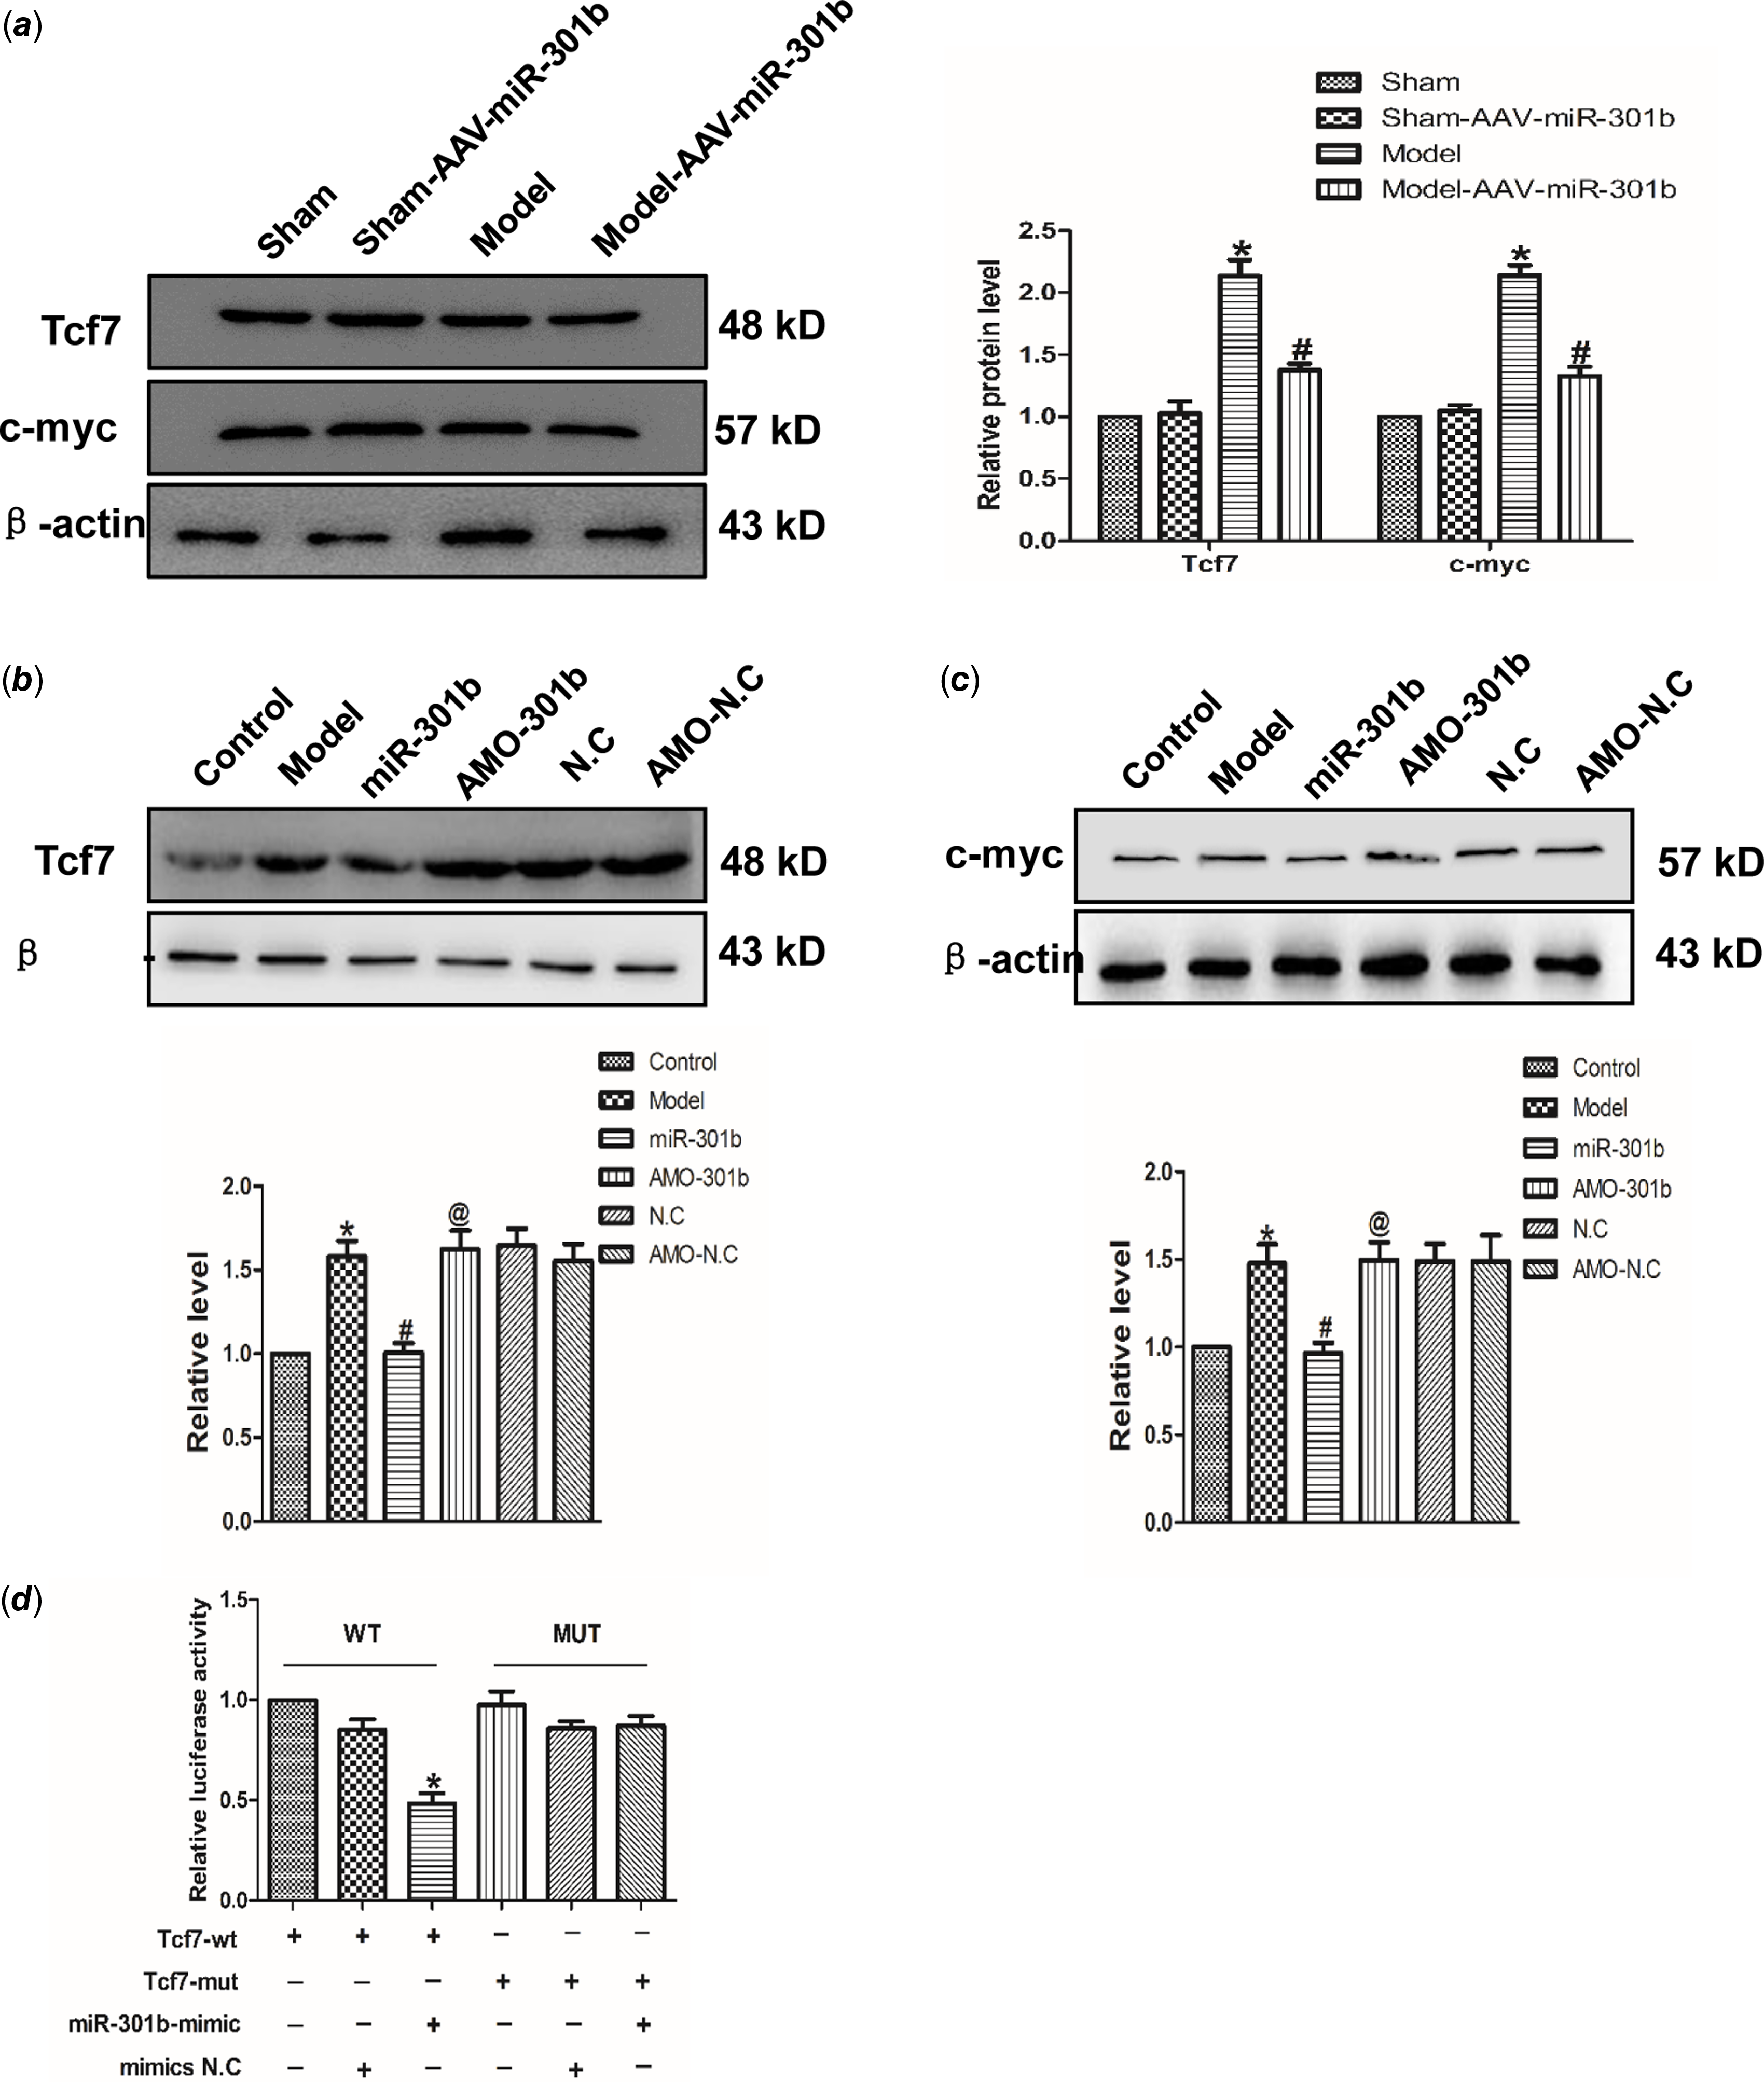
Figure 5. Tcf7 is the target gene of miR-301b in cardiac hypertrophy (a) Western blot results of Tcf7 and c-myc proteins expression by miR-301b mimic in vivo. Data were represented by mean ± SEM (n = 6). *p < 0.05 versus Sham-AAV-miR-301b group; # p < 0.05 versus model group. (b) and (c) Western blot results of Tcf7 and c-myc proteins expression by miR-301b mimic in vitro. Mean ± SEM was used to analysis the data (n = 6). *p < 0.05 versus control group; # p < 0.05 versus model group; @p < 0.05 versus miR-301b group. (d) to further prove that the miR-301b act directly on Tcf7, luciferase reporter gene was performed. Mean ± SEM was used to analysis the data. *p < 0.05 versus Tcf7-WT group, n = 6.
LncRNAKCNQ1OT1 contributes to cardiac hypertrophy via miR-301b mediated regulation of Tcf7
To investigate the relationship between lncRNA KCNQ1OT1 and miR-301b, the luciferase activity was tested. As shown in Fig 6a, miR-301b luciferase activity was decreased in cardiomyocytes, transfected with lncRNAKCNQ1OT1. However, silencing miR-301b led to an increase in the luciferase activity of lncRNAKCNQ1OT1. These results indicating that lncRNAKCNQ1OT1 bound miR-301b to negatively regulate miR-301b. Moreover, as displayed as Fig 6b, lncRNAKCNQ1OT1 decreased the luciferase activity of Tcf7, while this effect could be reversed by miR-301b knockdown, indicating that lncRNAKCNQ1OT1 by negatively modulating miR-301b to regulate Tcf7. Collectively, these data suggest that lncRNAKCNQ1OT1 contributes to cardiac hypertrophy via miR-301b mediated regulation of Tcf7.
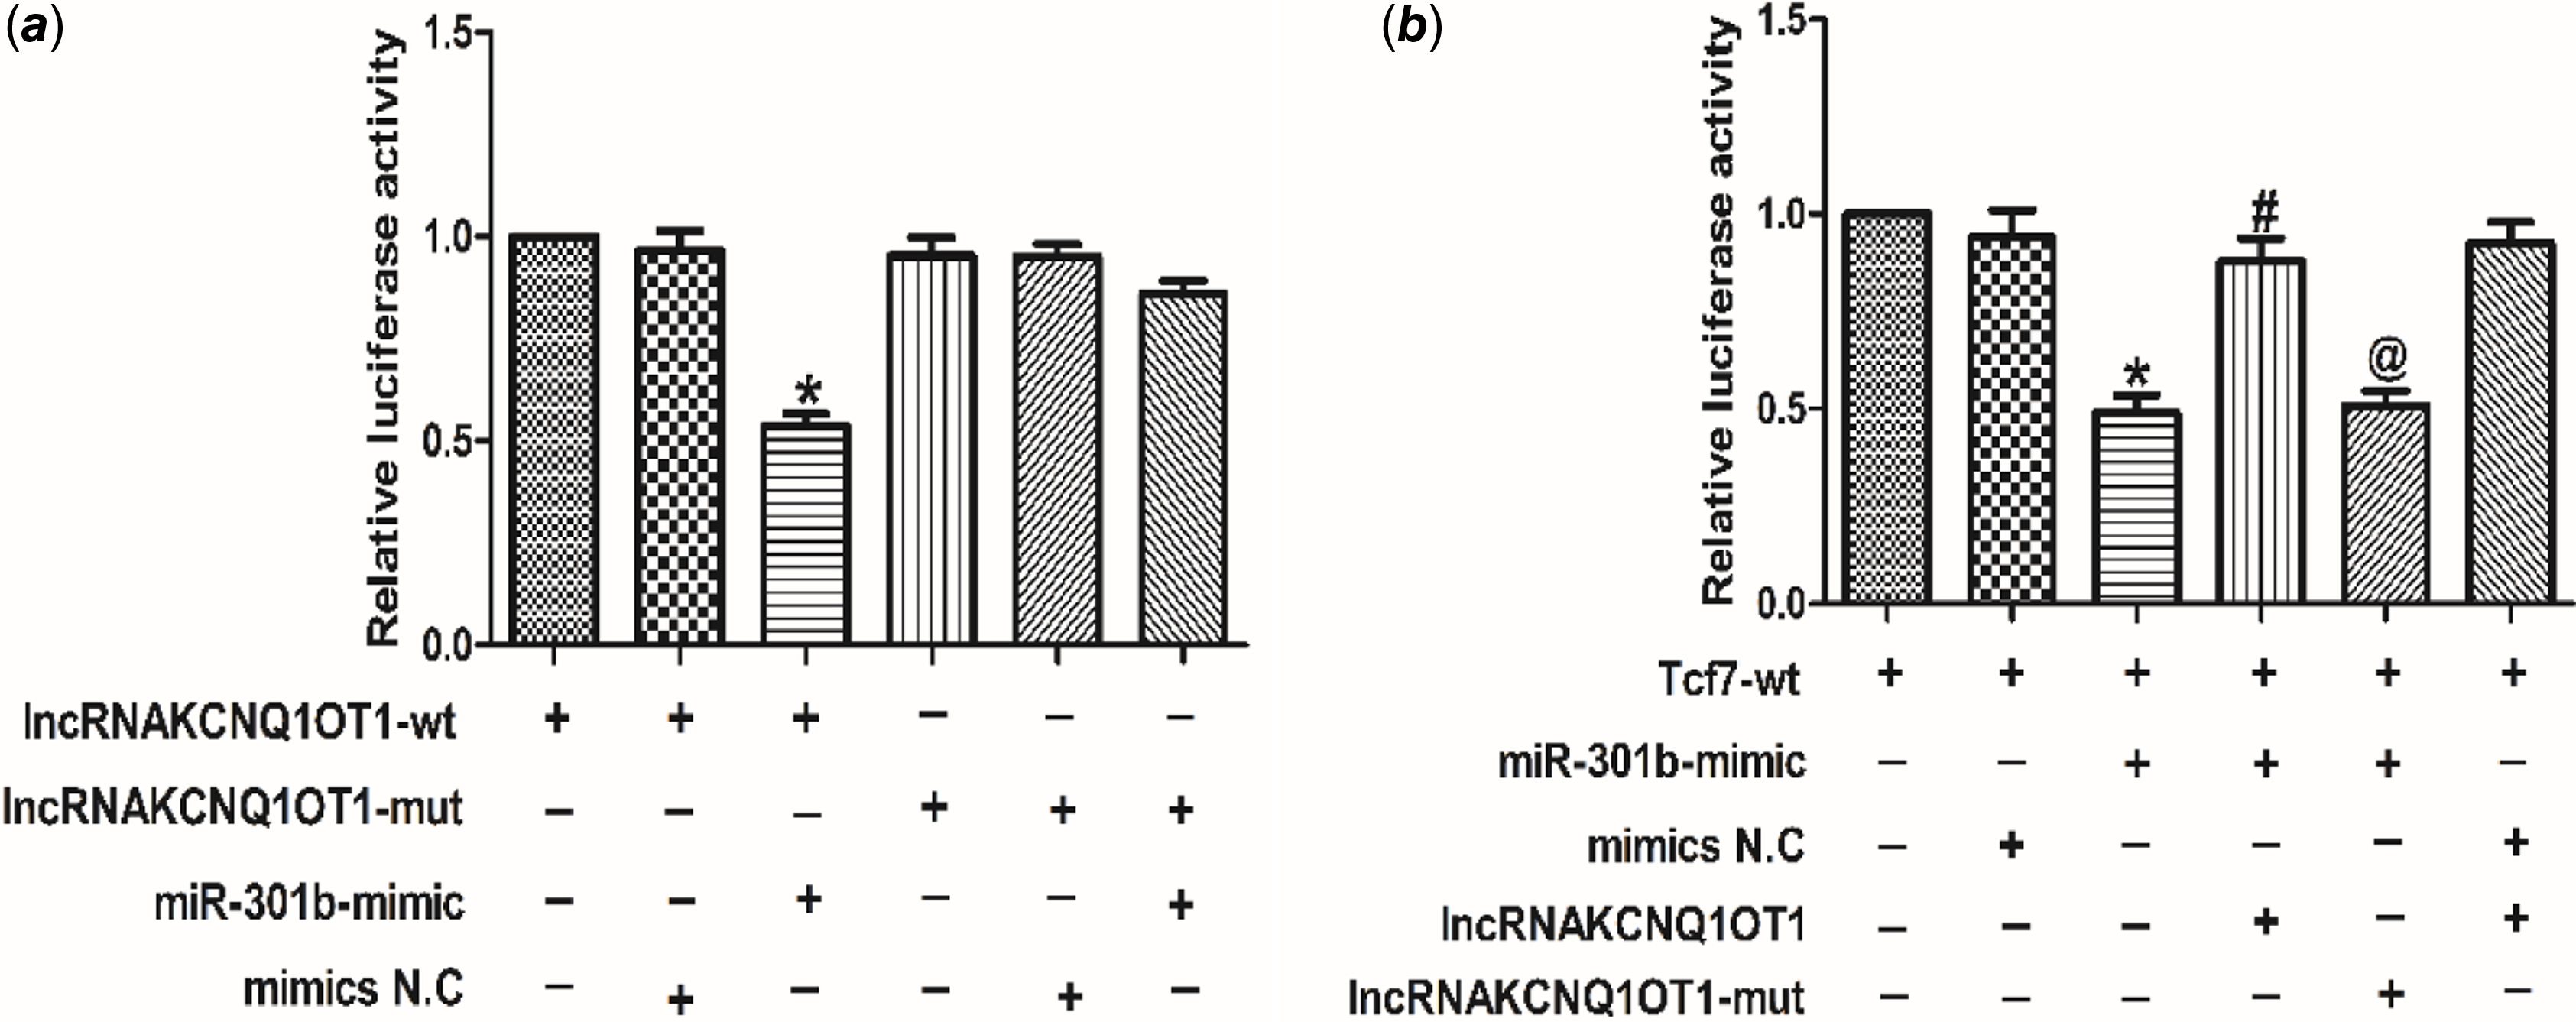
Figure 6. The relationship between lncRNAKCNQ1OT1, miR-301b and Tcf7 (a) luciferase reporter gene of chimeric vectors carrying the luciferase gene and a fragment of lncRNAKCNQ1OT1 containing wild-type or mutated miR-301b binding sites. Mean ± SEM was used to analysis the data (n = 3). *p < 0.05 versus lncRNAKCNQ1OT1-WT group. (b) the luciferase reporter gene was performed to validate the regulatory interactions among lncRNAKCNQ1OT1, miR-301b and Tcf7. Mean ± SEM was performed to analysis the data (n = 6). *p < 0.05 versus Tcf7-wt group, #p < 0.05 versus Tcf7-wt+miR-301b-mimic group, @p < 0.05 versus Tcf7-wt+miR-301b-mimic+lncRNAKCNQ1OT1 group.
Discussion
Cardiac hypertrophy, a process of adapting to cellular stress, is manifested in the increase of myocardial cell volume at the cellular level, and enhanced cell diameter, length and ventricular wall mass at the tissue level. Pathological cardiac hypertrophy acts as a reaction to disease or stress, resulting in elevated cell volume and myocardial protein synthesis, which is different from athletes’ heart. Long-term stress induced pathological cardiac hypertrophy may led to heart failure. The latest research has revealed ceRNAs play an important role in cardiac hypertrophy. However, the mechanism of which have not been clearly defined. Briefly, this research has indicated lncRNAKCNQ1OT1 was able to regulate cardiac hypertrophy by sponging miR-301b via suppression of Tcf7.
Tcf7 has been identified as a vital participant in lots of diseases, for instance: pancreatic cancer and colorectal cancer. Reference Xiang, Hu and Qin23,Reference Cui and Hong24 Meanwhile, as a member of Wnt signalling pathway, Tcf7 is associated with cardiac developmental processes. Reference Iyer, Nagarajan and Woelfer25 Our research further revealed that Tcf7 protein level and its downstream target gene c-myc protein was significantly up-regulated in cardiac hypertrophy. In order to ascertain the effect of Tcf7 in cardiac hypertrophy, Tcf7 was silenced by siRNA technology. Myocardial cell surface area was decreased by siTcf7. Consistent with this finding, levels of BNP and β-MHC, which regarded as hypertrophic markers, were also significantly down-regulated. Likewise, results displayed c-myc level was also down-regulated after Tcf7 knockdown. It was speculated that the activation of Tcf7 could increase c-myc level and eventually cause cardiac hypertrophy.
MicroRNAs could induce messenger RNA degradation by binding to the 3' untranslated region of messenger RNAs. The study has displayed important effect of microRNAs in cardiac disease, such as myocardial ischaemia, arrhythmia, and myocardial fibrosis. For instance, miR-133 was decreased in cardiac hypertrophy. Reference Diniz, Lino, Guedes, Nascimento Moreira and Barreto-Chaves26 MiR-22 and miR-27b also have effects on cardiac hypertrophy. Reference Huang, Chen and Seok27,Reference Wang, Song and Zhang28 However, whether miR-301b is critical to cardiac hypertrophy has not been reported. MiR-301b was predicted to be increased in the cardiac hypertrophy model by bioinformatic approach-a finding that triggered the present study. MiR-301b overexpression down-regulated myocardial cell area as well as BNP and β-MHC level. In contrast, the effect can be reversed by AMO-301b. These findings suggested that miR-301b inhibits cardiac hypertrophy. Furthermore, the relationship of miR-301b and Tcf7 was assessed by targetscan software. Western blot results displayed Tcf7 level was inhibited when overexpressing miR-301b, and promoted by AMO-301b, compared with the control group. Subsequently, luciferase reporter assay displayed that Tcf7 was a target gene of miR-301b, indicating that miR-301b bind to Tcf7 3’ untranslated region and repress its activity.
Apart from coding genes, lncRNAs take important roles in cardiac diseases. A crucial discovery of our research showed that lncRNAKCNQ1OT1 was highly expressed in hypertrophic mice. The significantly higher expression level of lncRNAKCNQ1OT1 was also demonstrated to induce cardiac hypertrophy by gain-and-lose function assay. Moreover, lncRNAKCNQ1OT1 has been proven to regulate miR-301b expression in cardiac hypertrophy via recruitment of Tcf7. This finding underscores the intricate regulatory networks involving lncRNAs in cardiac pathophysiology. We also acknowledge certain limitations in our study: Firstly, our experiments in mouse and cell models have demonstrated that lncRNAKCNQ1OT1 could promote the development of cardiac hypertrophy by regulating miR-301b and Tcf7. These findings will need future validation in human disease tissues to confirm their applicability. Secondly, while we have elucidated the potential regulatory relationship between these entities, further research is necessary to determine whether a similar expression and regulatory relationship exists in human tissues.
In summary, our research illustrates that lncRNAKCNQ1OT1, suppressing the expression of Tcf7 by sponging miR-301b. This suppression, in turn, leads to the reduction of c-myc activity and eventually induce cardiac hypertrophy. Our research revealed a novel lncRNAKCNQ1OT1/miR-301b/Tcf7/c-myc axis, which provides a deeper understanding of the mechanisms underlying cardiac hypertrophy. This insight offers promising new avenues for therapeutic intervention by targeting this specific signalling pathway to prevent or mitigate cardiac hypertrophy.
Acknowledgements
Thanks to the Education Department of Jilin Province and Baicheng Medical College for providing funds and laboratory for this study. The pre-print version of article could be found in Research Square (https://assets.researchsquare.com/files/rs-965129/v1/a3c66f59-3268-42a4-81f7-de91aca7441f.pdf?c=1634233167; DOI: 10.21203/rs.3.rs-965129/v1).
Author contribution
Mingyao E was responsible for design of the subject and the writing of the paper; Yanhua Yu and Haiyan Li are responsible for data collection; Feifei Ren and Chao Shen were in charge of molecular biology experiments.
Data availability
The data that support the finding of this study are available from the corresponding author upon reasonable request.
Financial support
This work was supported by The Education Department of Jilin Province, China [Grant numbers 1564557149790].
Competing interests
All the data are true and reliable. The authors declare that they have no conflict of interest. There is no objection to the content of the text.
Ethical standards
All animal experiments were approved by the Ethics Committee of Baicheng Medical College (License No. 235BMC-2020, September 2020).

